You can narrow the range with your mouse, by clicking on axis and dragging marked area while still holding mouse-button. This works on all axes.
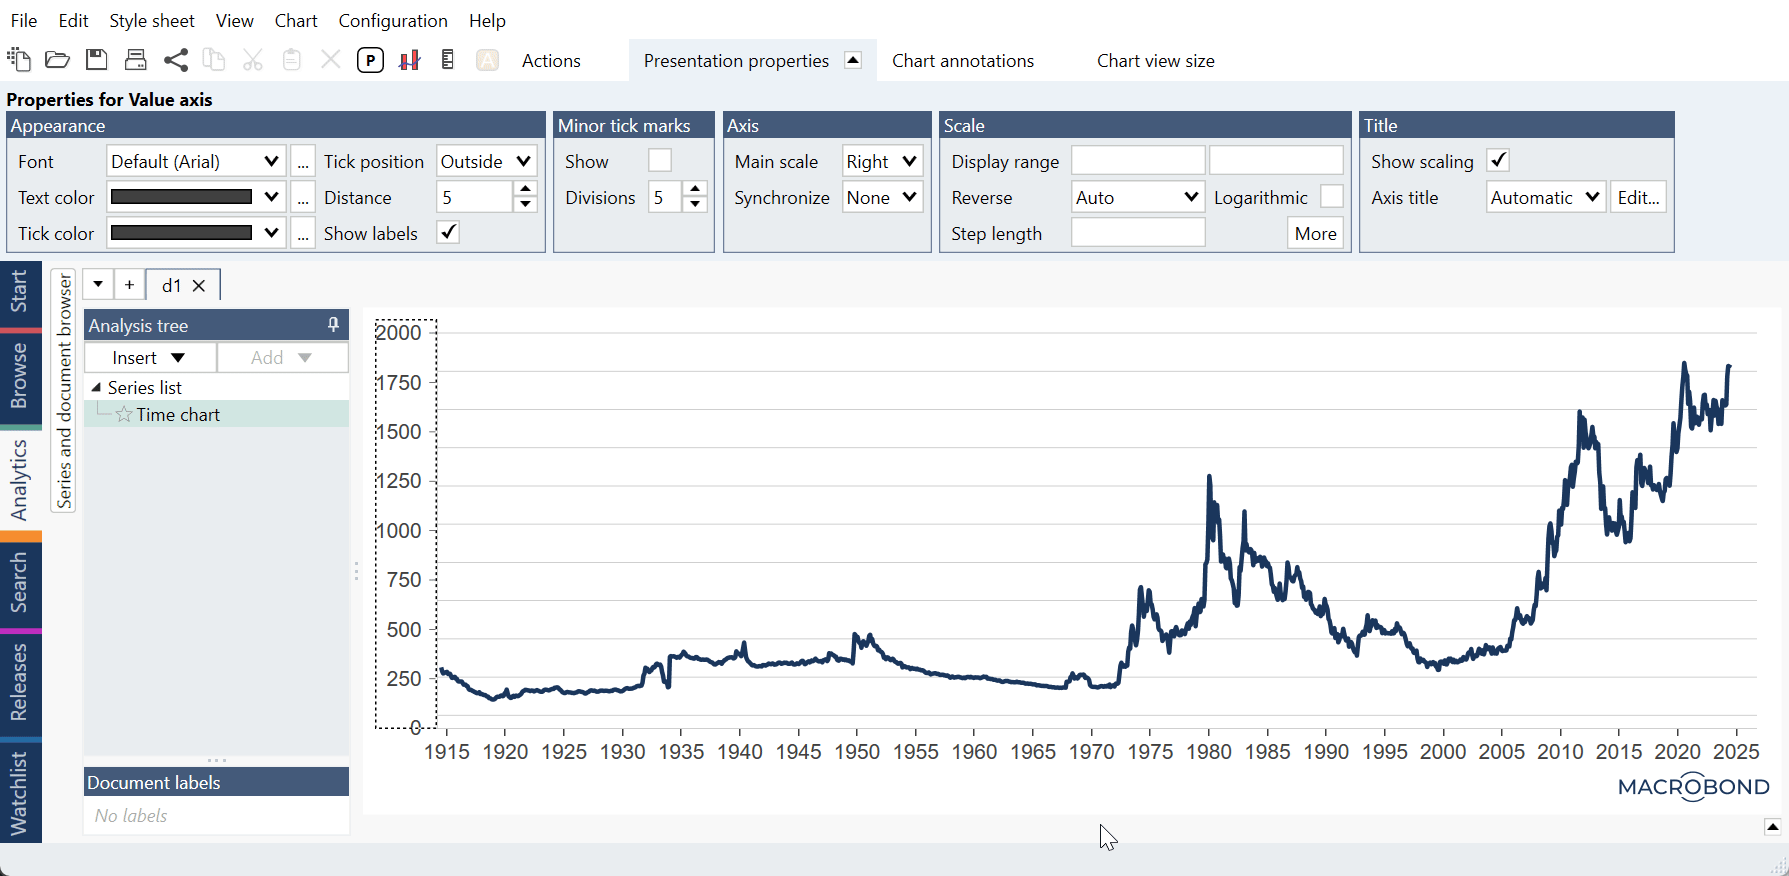 If you need more precise method or want to apply dates/values manually, click on axis and go to Presentation properties > Scale > Display range.
For Time charts' x-axis input dates in your Windows' format.
For Category charts' x-axis use positions i.e., #0, #2.
For y-axis remember that Macrobond automatically scale values. If your scale is in trillions you need to type in 15000000000000 or 1,50E+13 in E-notation.
Note that when step length is not set, the drawn range can be bigger than the specified start and end so that you get a nice step length and the first and last tick is close to the chart edge. If you want to override this completely set manually start, end and step length.
For more information: