- Overview
- Settings
- Calendar mode
- Include only periods available in all series
- Rebase
- Use legacy format
- Examples
Overview
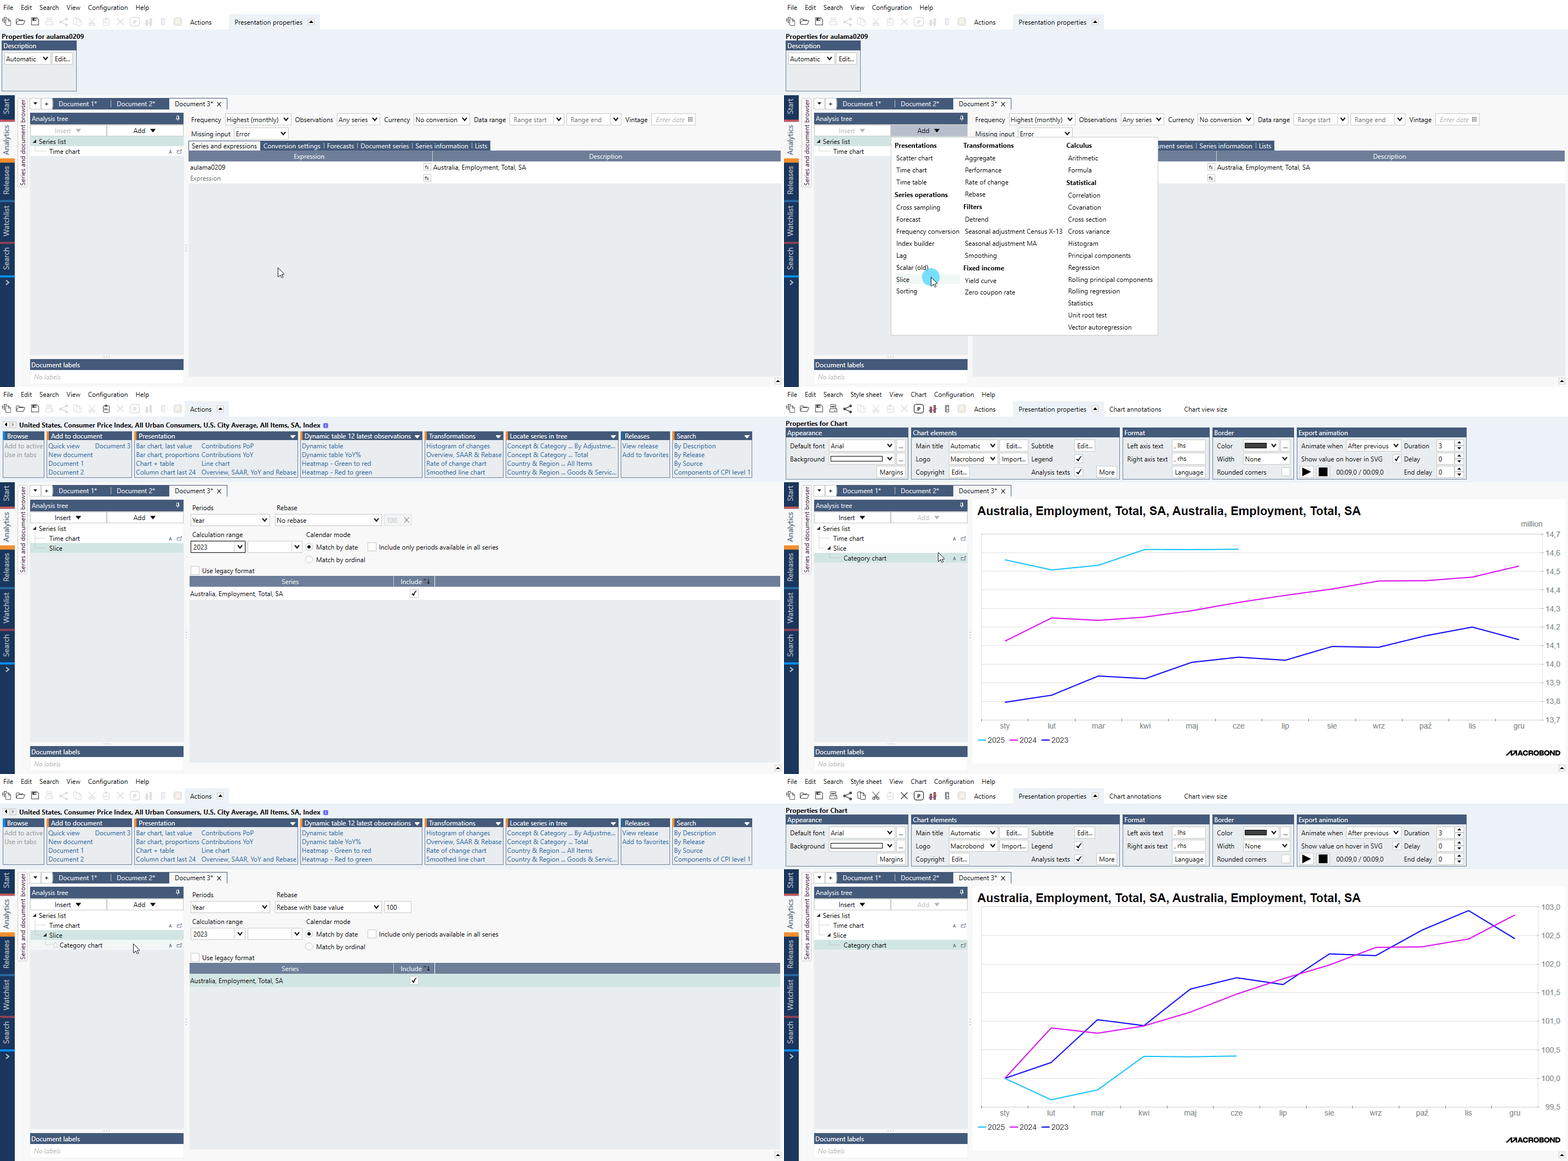
Example of general use of Slice analysis comparing individually rebased year-length slices:

The Slice analysis cuts a time series into several pieces to compare different periods of time on a graph. For instance, to compare GDP recovery after each recession period you would use this functionality.
Settings
Period
is the first setting that you should specify. You have 3 main options to slice the series:
Set to year/quarter/month
this setting cuts series into calendar periods. The time series will therefore be sliced on a yearly/quarterly/monthly basis, meaning that one series per period will be produced. You can then specify the calculation range, which refers to the time horizon on which you want to slice the series.
Custom ranges
This setting slices time series for specific ranges of observations that you set manually.
The ranges can be open-ended.
Custom points in time
Series will be cut into several periods that are defined by:
- a referenced 'point in time'
- the length, that is specified in terms of number of observations
- the relation between the length set and the referenced point in time: after / around / before.
Calendar mode
This setting determines how to align the different years (or quarter or months, depending on your selection of the period). It makes a difference for series that are daily or have skipped dates.
If the mode is set to 'date' the observations for each slice are align based on the month and day of the observations.
If the mode is set to 'ordinal' the observations are aligned purely based on the order within the period. This mode is recommended for daily series.
Include only periods available in all series
It will exclude periods that are not available in all series. Recommended for removing gap when there's a leap year.
Rebase
Rebase with base value
When selected, this setting will rebase all series produced at their starting point with chosen base value, typically 100.
Additive rebase with base value
This feature is available in Macrobond 1.30 and later.
Each value of the timeseries in the underlying segment will be subtracted with the first value of the segment minus the value you input. This is particularly useful when you want to have result of each segment starting at 0.
Use legacy format
Checking this option will enable legacy output meaning the analysis won't group slices into lists. Please note that by enabling this option all following analyses will lose their settings.
Examples
Slice series and rebase its value.
In this example, we look at average monthly performance of S&P Index since 1928.
In this example, we chose to have 3 sliced series starting respectively in 1929-09-01, 1987-09-01 and 2008-08-15, with a length of 2500 observations after these dates. Here, we used the S&P 500, and comparing it after the 3 main financial crises. The sliced series are rebased to 100 to facilitate the comparison.
Here, we listed the periods between US recessions. We ticked the rebase option to ensure sliced series are comparable - they all will start at 100. This way we will see how jobless claims evolved after each recession period.