- Overview
- Available bands
- Adding recession bands
- Edit/customize recession bands
- Removing recession bands
Overview
Fill range is a function that fills a segment of a chart with color, based on a defined range or sequence of dates. A fill range can be used to draw attention to a segment of the charted data. Alternatively, you can use the fill range function to create an additional layer of information like recession periods.
Available bands
Economy turning points - 1 in the series for all negative quarters and 0 for all positive quarters. It simply tracks when the economy switches from growth to decline and back again
Recession (shortening) - recession bands based on a business cycle data from other providers.
Recession (simplified) - recession (1 in the series) starts after two negative quarters in a row, with the first recession quarter being the first negative quarter. That means that once a recession has been confirmed by having two negative quarters in a row the 0 in the first negative quarter is overwritten with a 1. Growth (0 in the series) starts on the first positive quarter.
Recession - recession (1 in the series) starts after two negative quarters in a row, with the first recession quarter being the second negative quarter. Growth (0 in the series) starts after two positive quarters in a row, with the first growth quarter being the second positive quarter.
Systemic banking crisis (IMF) - 1 is used to mark when a crisis starts, and it is repeated through years until the end date, which we mark with 0. If a crisis starts and ends the same year, that year is marked with 1". Underlying data set was discontinued by the source.
Adding recession bands
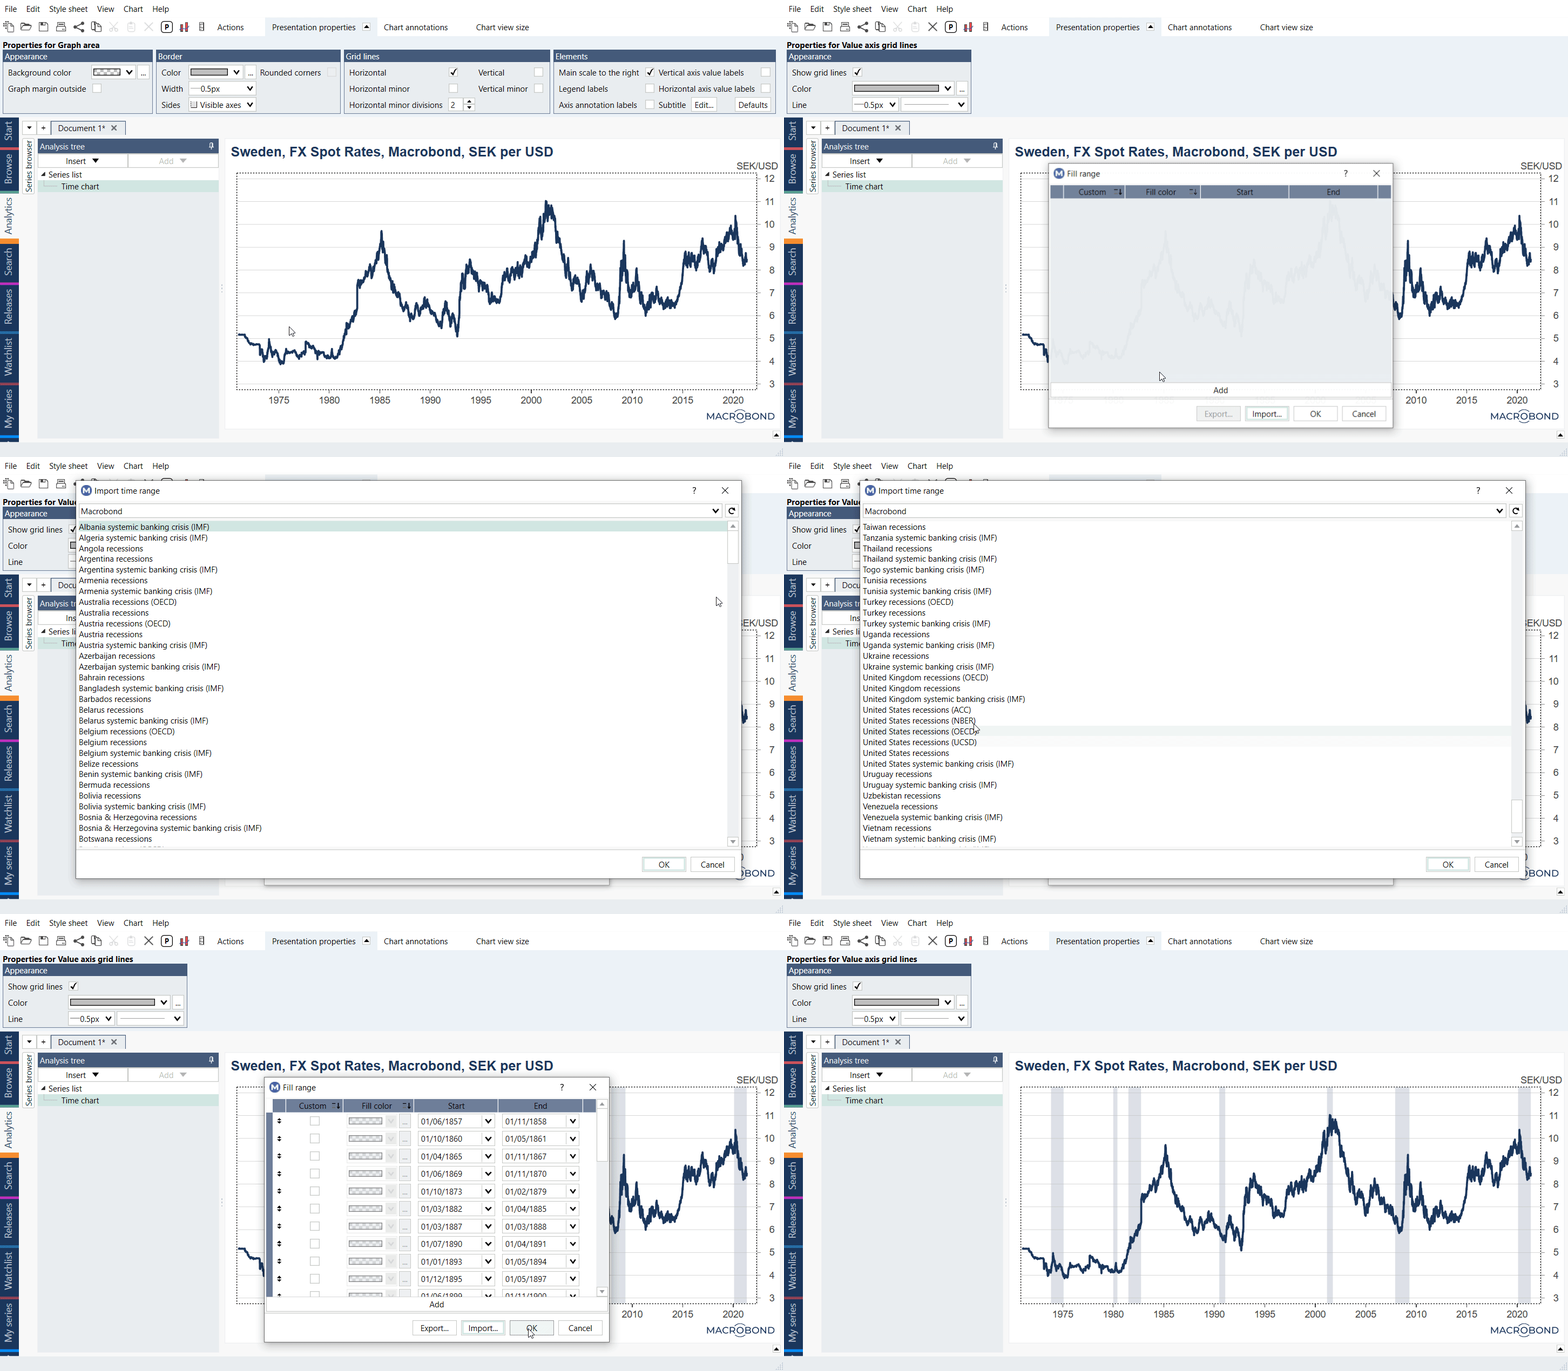
To add recession bands (shading), right-click in a chart and choose Fill range. In the Fill range window, click on the Import button and choose the desired country or region. When clicking 'OK', the selected recession band (shade) will be imported and can be further customized. The recession bands will be displayed as vertical shades over the specified period
Creating and saving custom bands
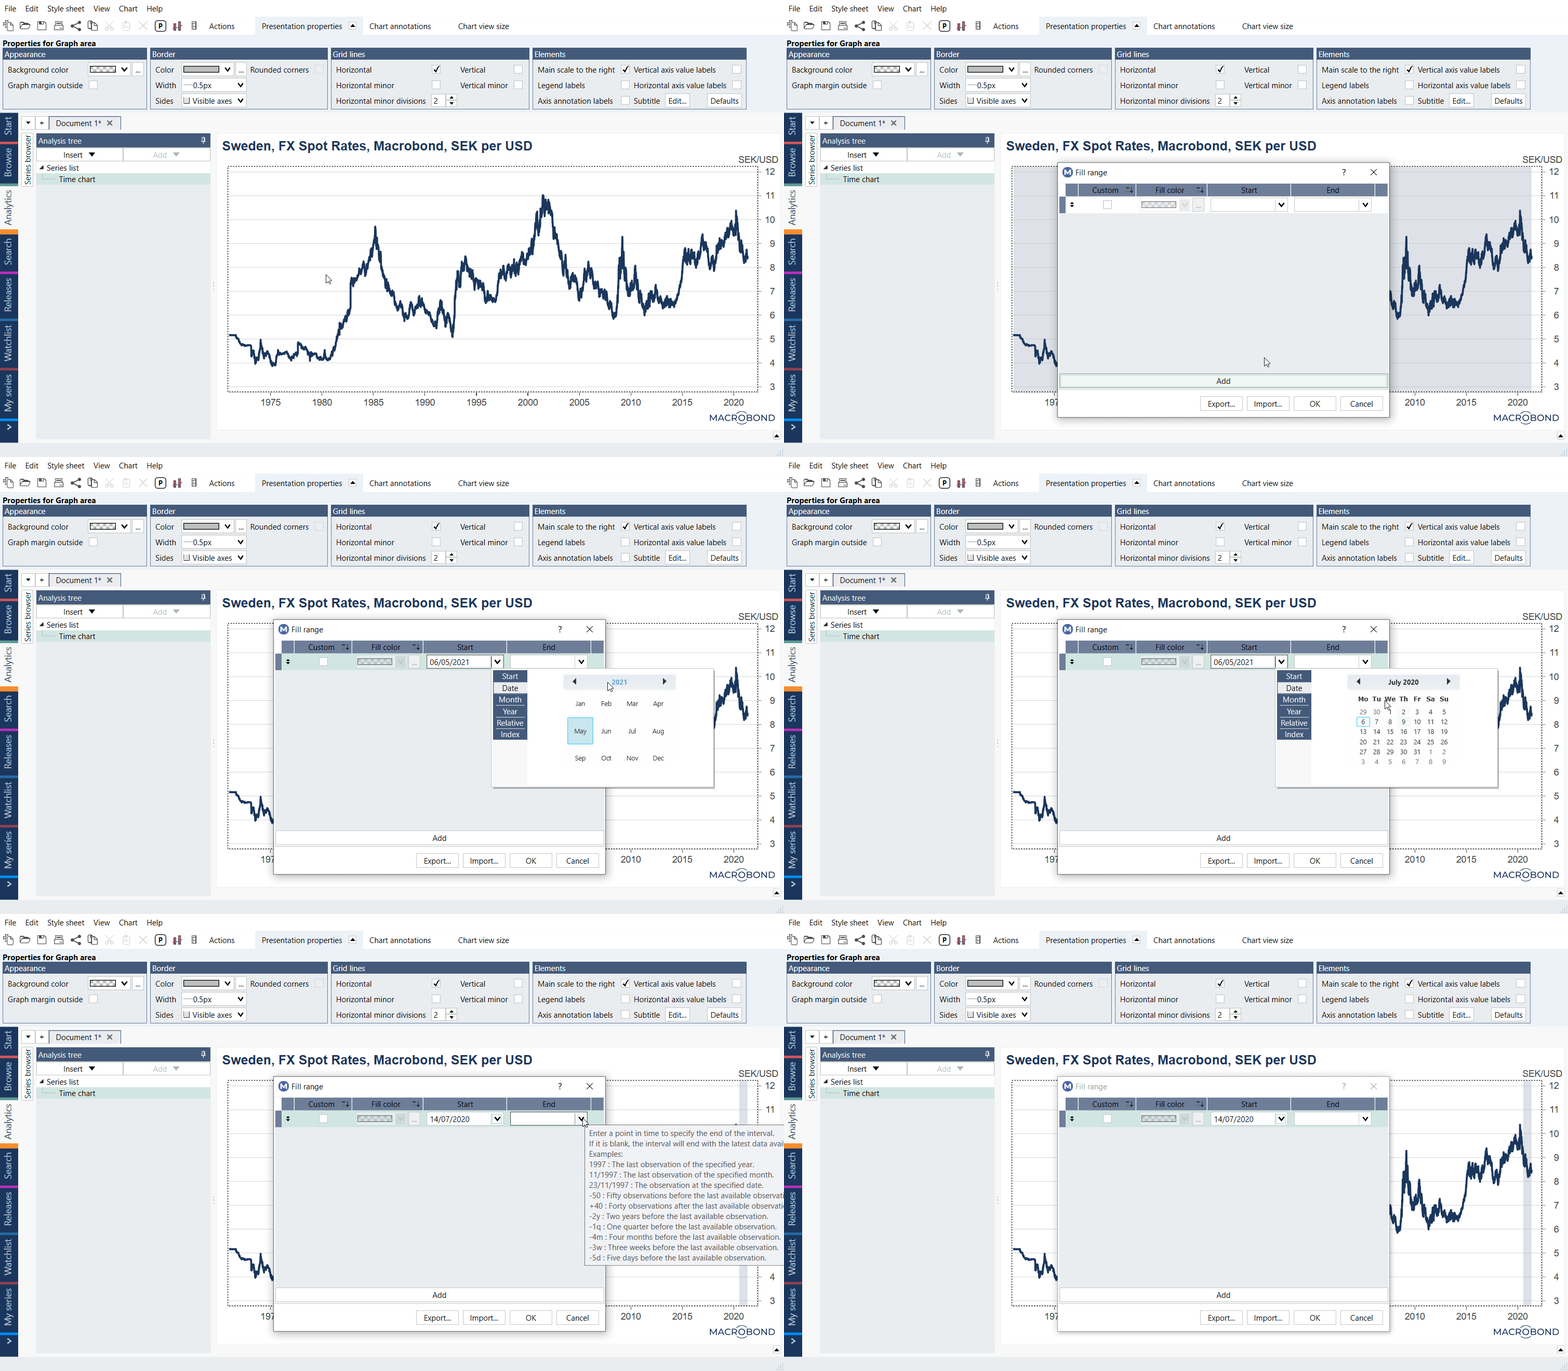
To create your own recession bands, or any other type of range, right-click in a chart and choose Fill range. To define a recession band, click on the add-button and set the start and end date. You can add several ranges to your chart in the same way.
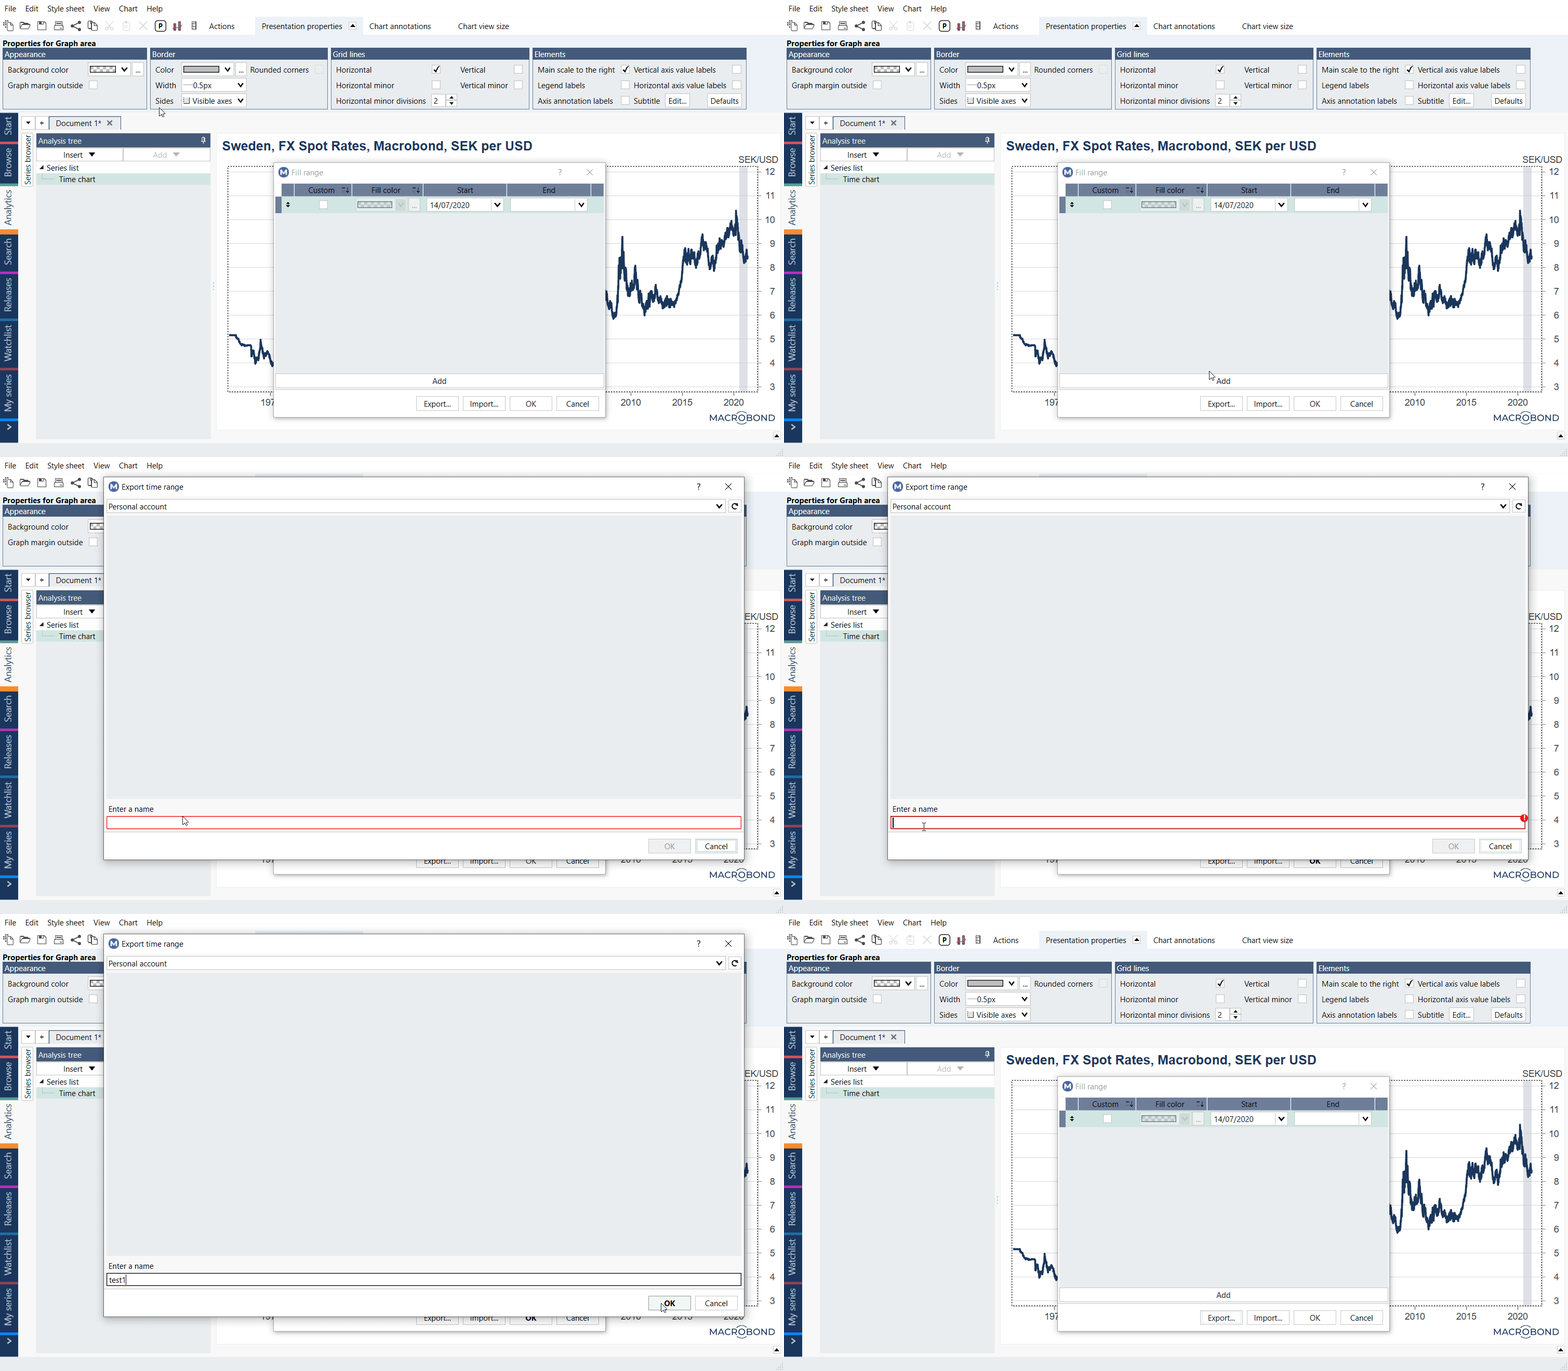
To save created bands click on the 'Export' button, choose an account, assign the recession bands a name and click the 'OK' button.
Dynamic recession bands
The Fill Range feature works as a charting tool, meaning that the recessions bands won't be updated with new recessions. If you want to keep them updated you can directly use the recession series in the document and display them as a 'fill' in Graph Layout, which will add shaded area to the chart. For more information about Fill graph type see Stripe, Range & Fill chart.
The series which can be used have aliases i.e., usrecession, derecession, jprecession or you can search for business cycle in Search activity.
Exporting and importing bands
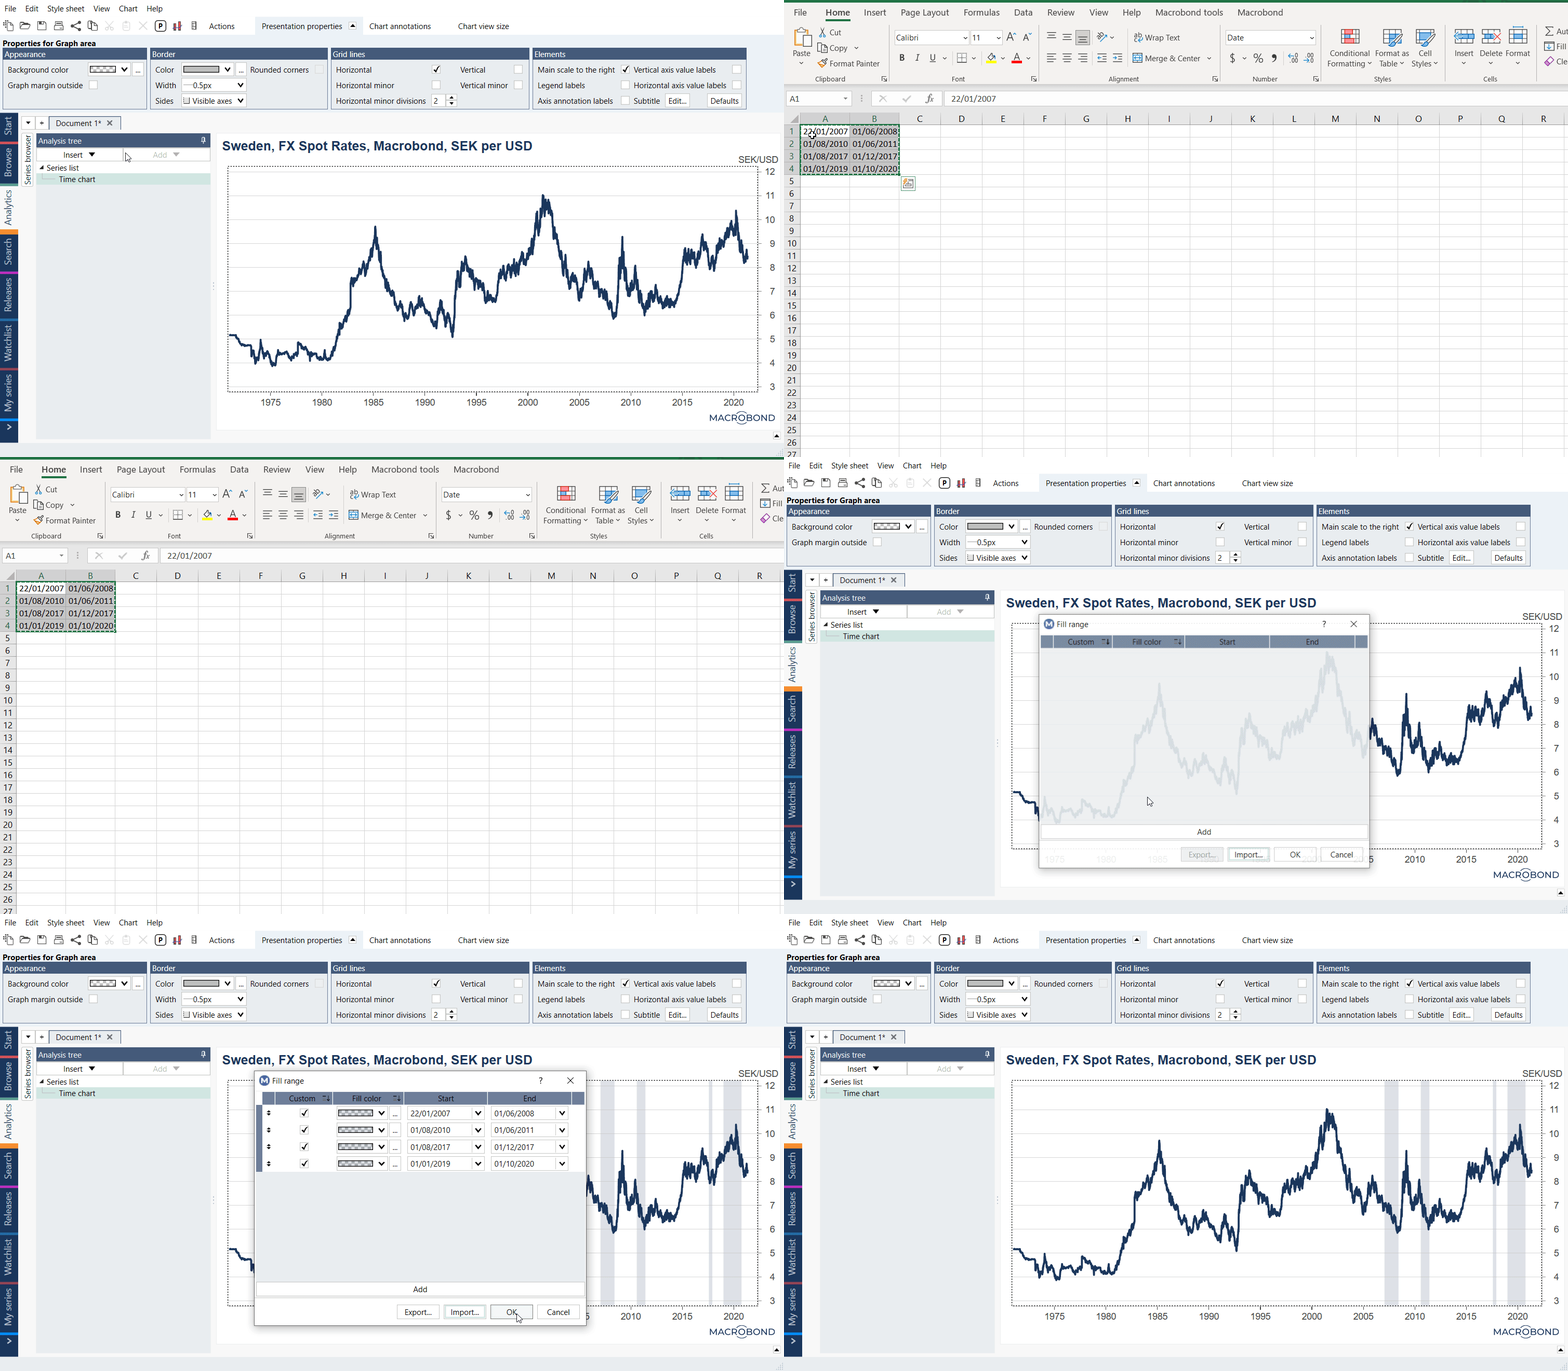
Construct two columns in Excel, the left column indicating the start date and right column indicating the end date of the range. Simply copy the dates from excel (using CTRL+C), right click in the Fill range window and paste the dates (using CTRL+V).
Edit/customize recession bands
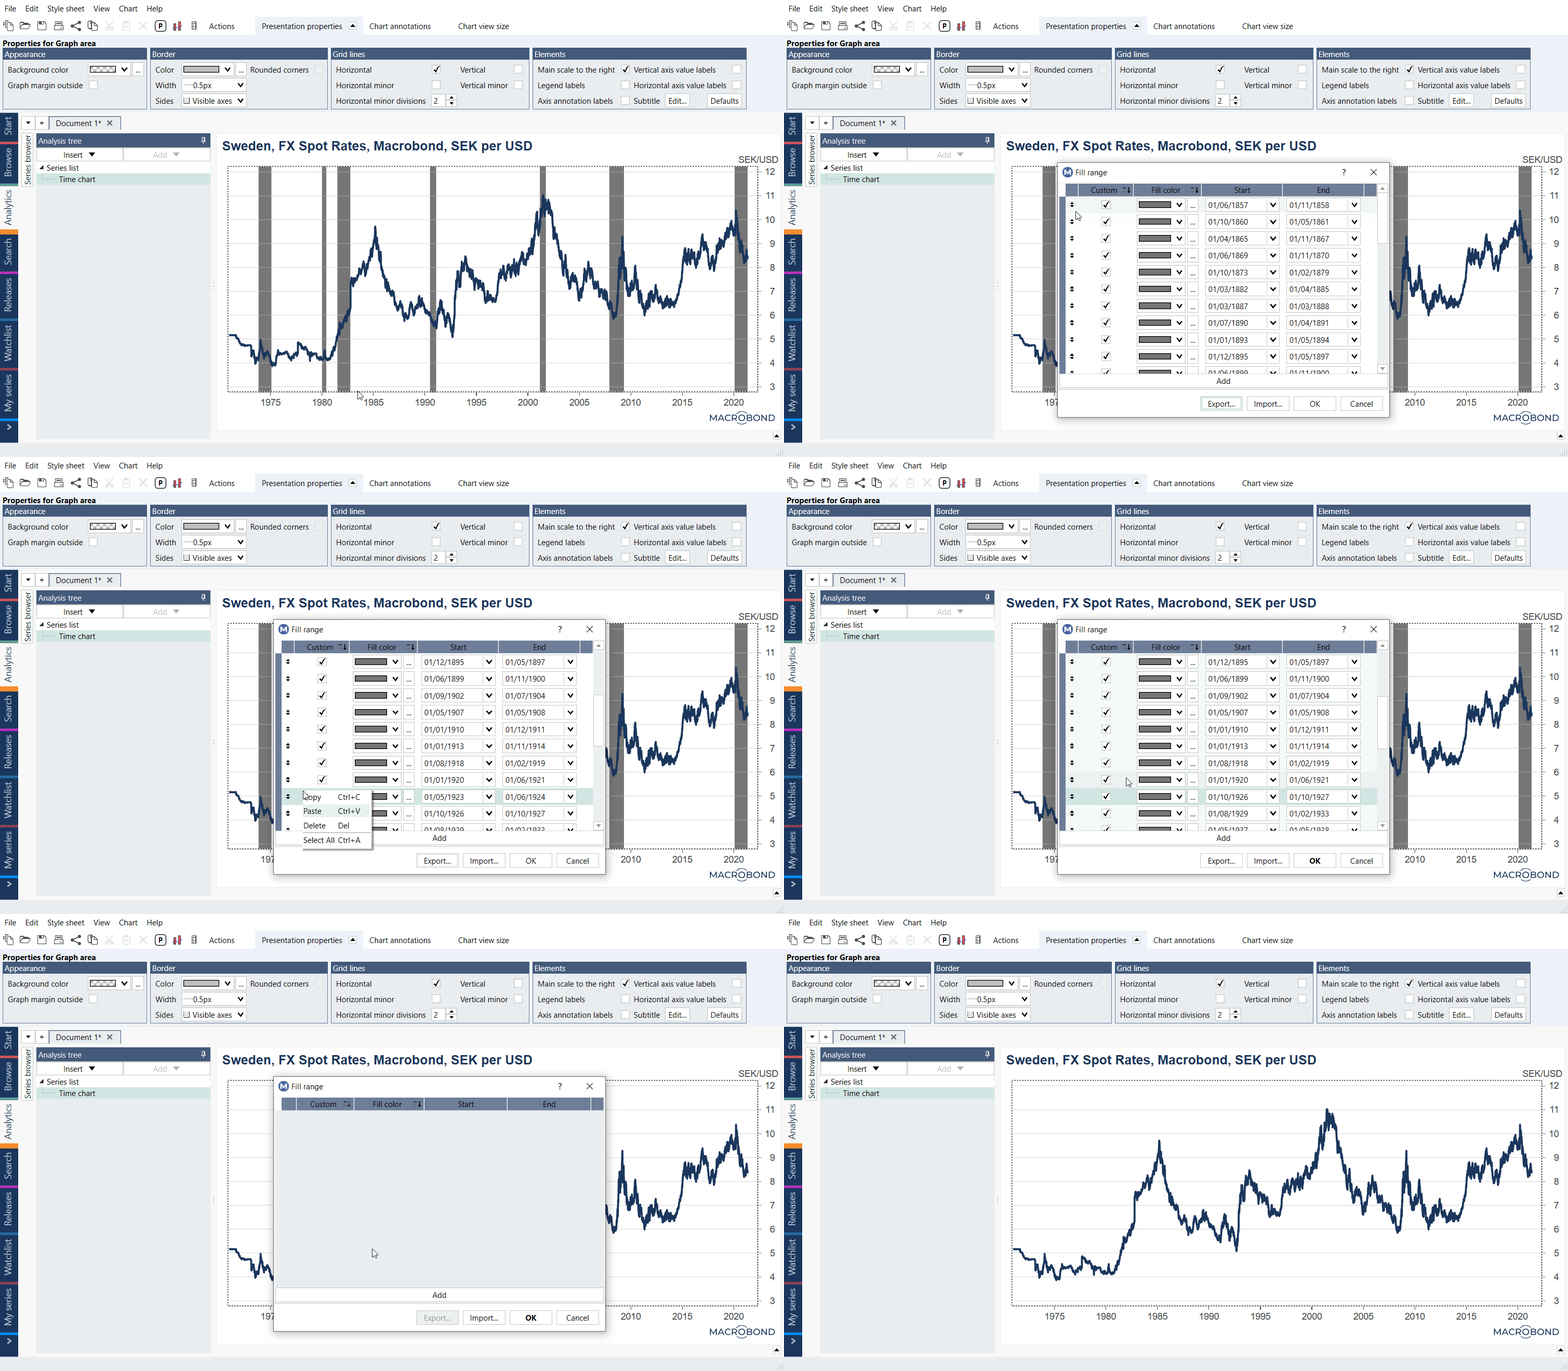
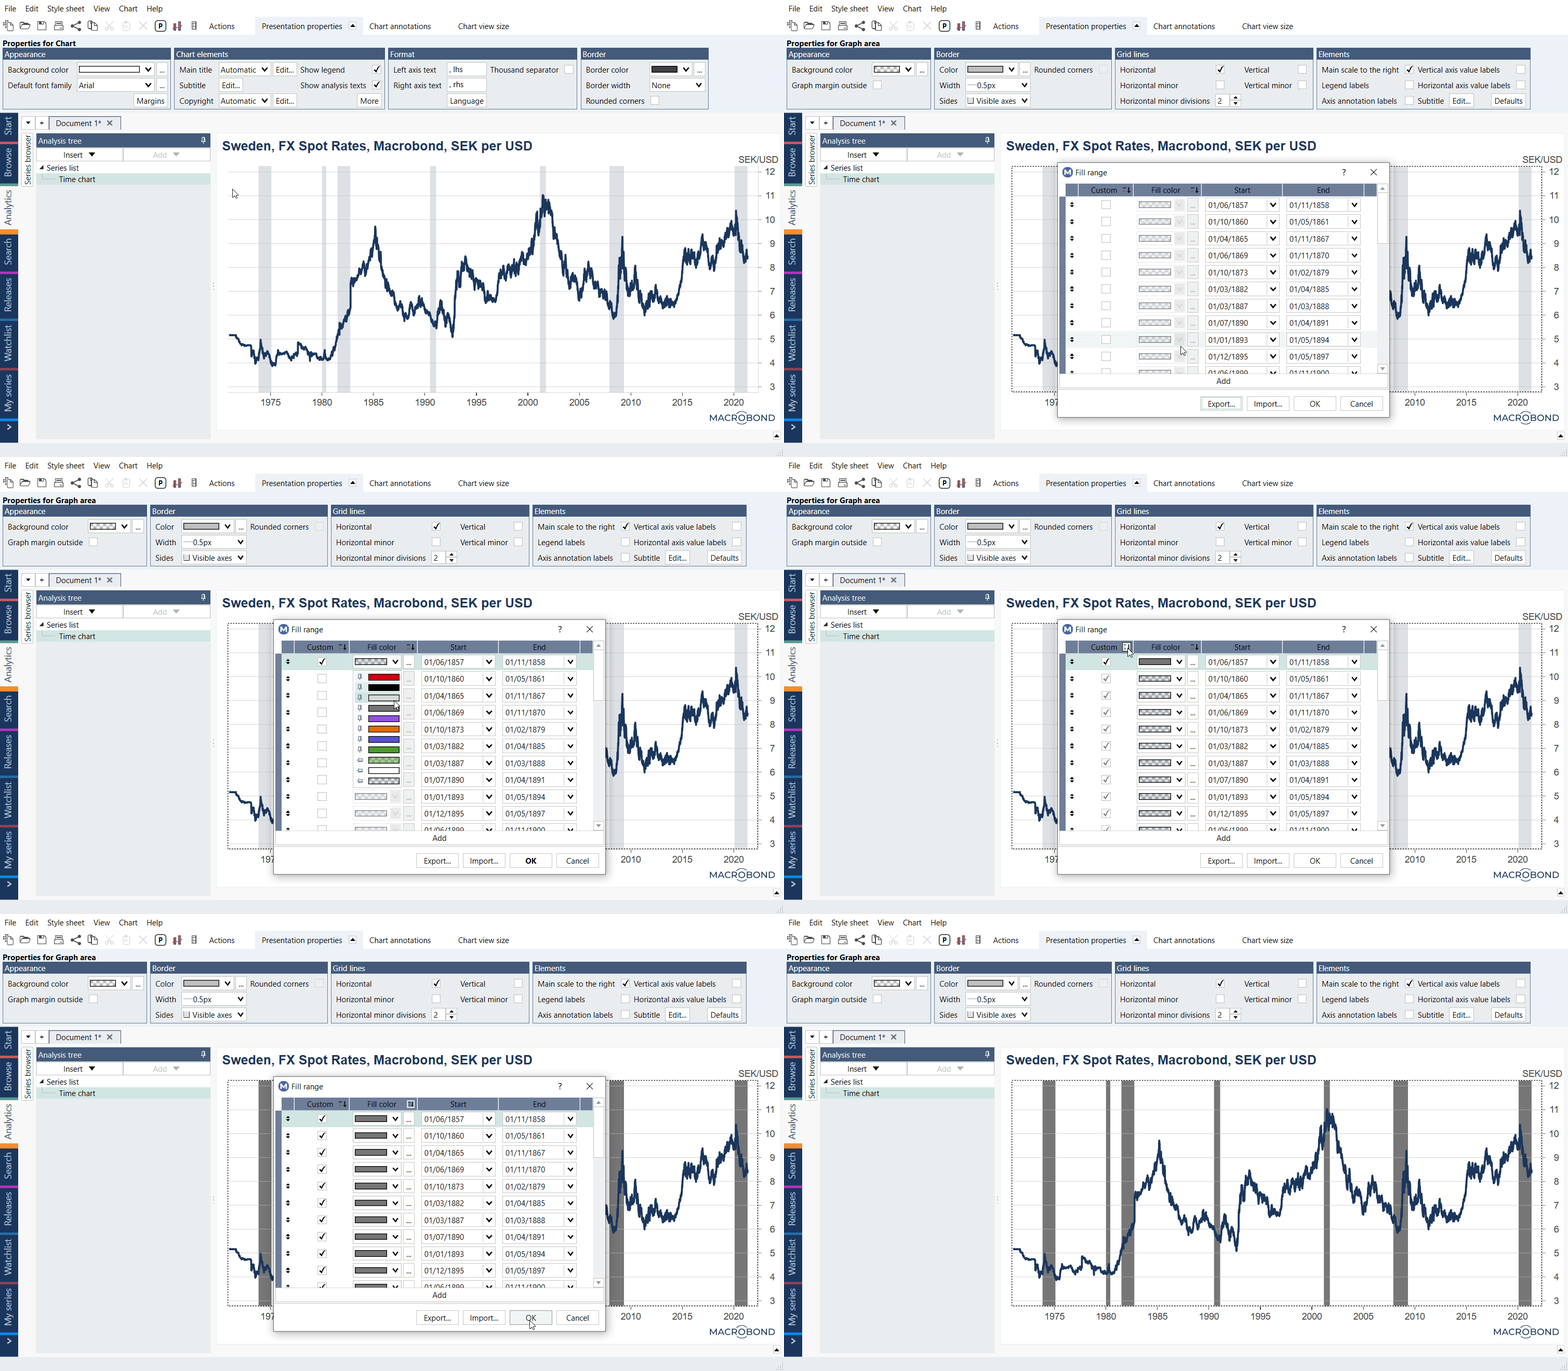
To edit a recession band or any other type of range, right-click in a chart and choose Fill range. You can now edit the dates. Check the box named 'Custom' to change the color and the opacity of the range.
Removing recession bands
To remove a recession period, right-click in the chart and choose Fill range. Right-click on the recession you wish to exclude and choose delete. You can select several ranges to be deleted by holding down CTRL and clicking on them. Using CTRL+A will select all periods at once.
