- Positioning the data set
- Adding metadata
- Inserting columns & rows in a data set
- Locating series in the data tree
Positioning the data set
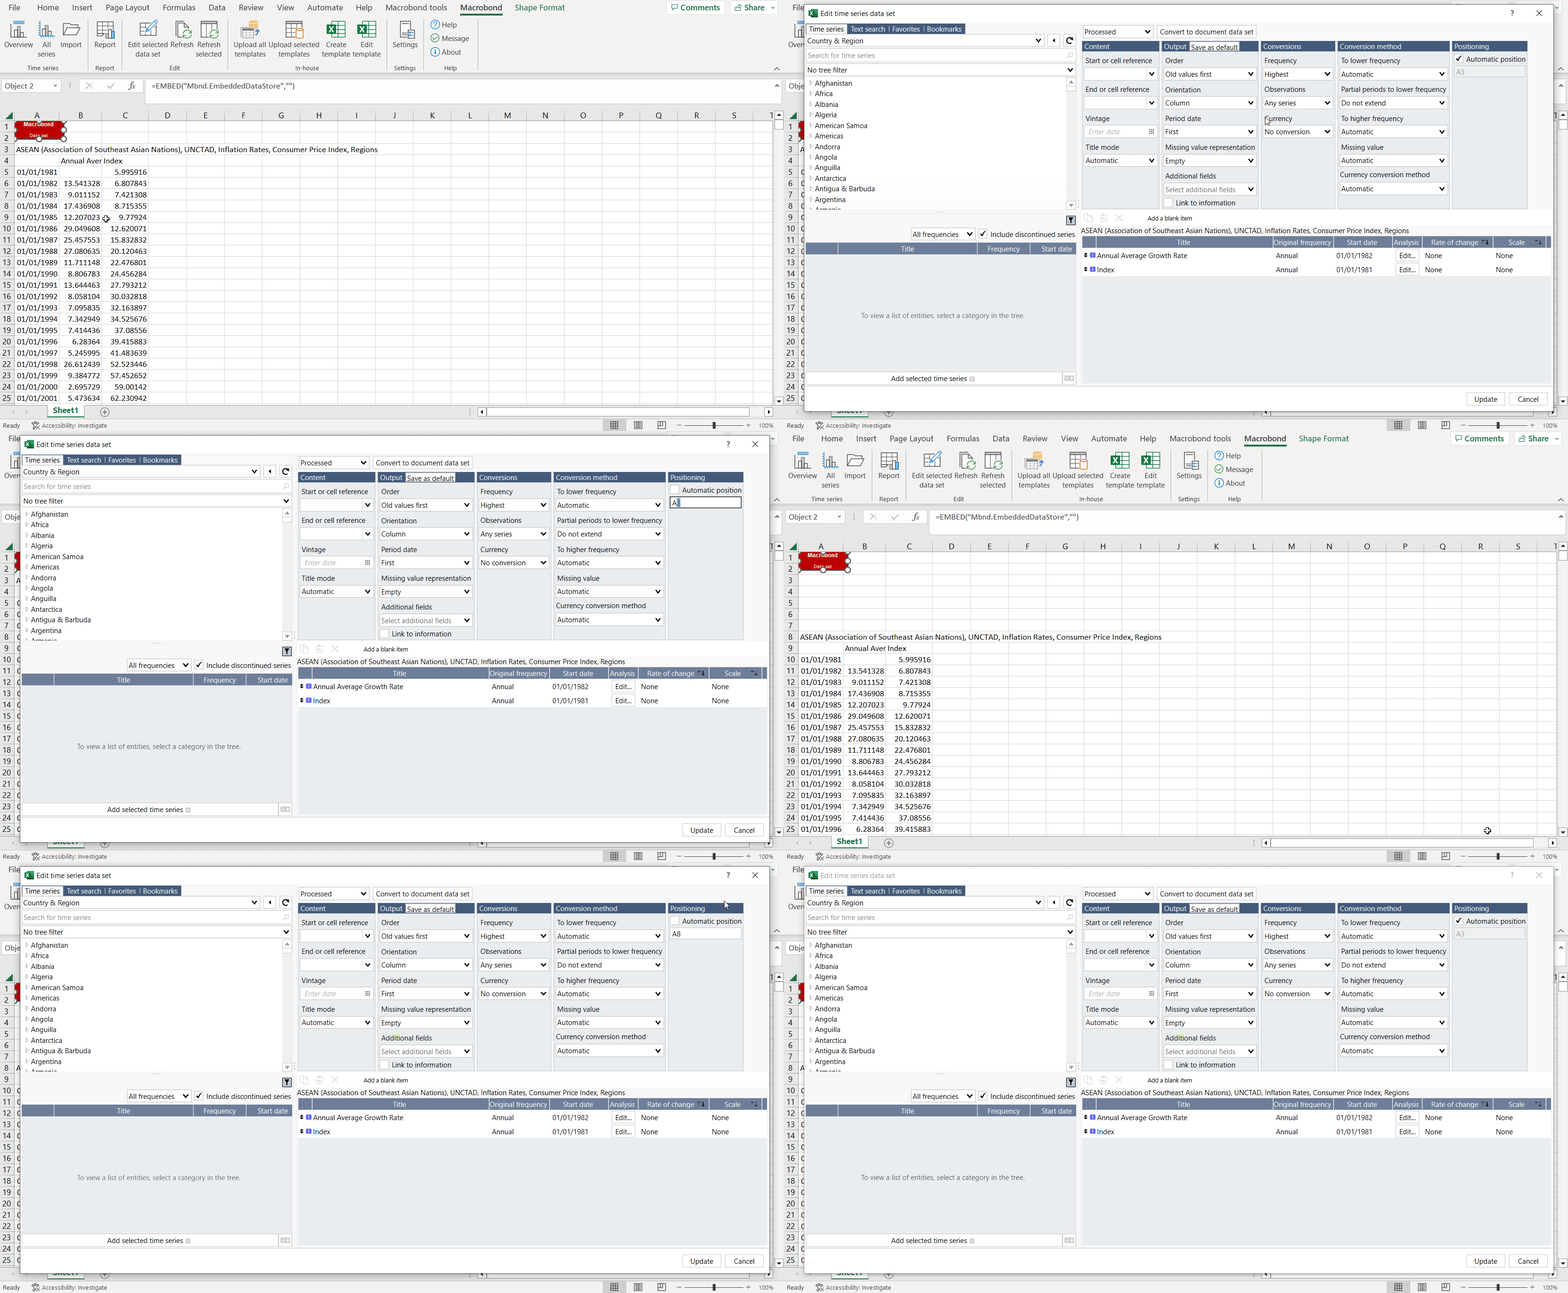
When you work in Excel, organizing data is crucial, especially if you download a lot of data sets from Macrobond into one sheet. Each data set you download from the Macrobond add-in comes with a red box like the one you see below. We call this the data set object, and it stores your downloaded data set as well as its settings.
By default, the location of the data is linked to the position of the red data set object. This allows you to move the entire data set by dragging the object to a new position. It’s a convenient way to organize your Excel file before working with the data.

So, when you start creating links and calculations with the data, it may be best to have the data set locked in a specific cell so that these links don’t get broken or reference the wrong cells.
To lock the data set, you need to access the Edit window. Right click on the data set object and select Edit. Here, you’ll find the Automatic positioning setting. Just uncheck the box, and enter the cell you want the data set to start in. Now the data set is locked to a specific cell, meaning that if we move the red object, the data will remain at the location we specified. This way, you don’t have to worry about updating links that you create in Excel.
Adding metadata
Metadata refers to additional information about a time series, like, for example, its source or next release date. When you download time series into Excel, you may want to include some metadata so that you can easily view this type of information without leaving Excel.
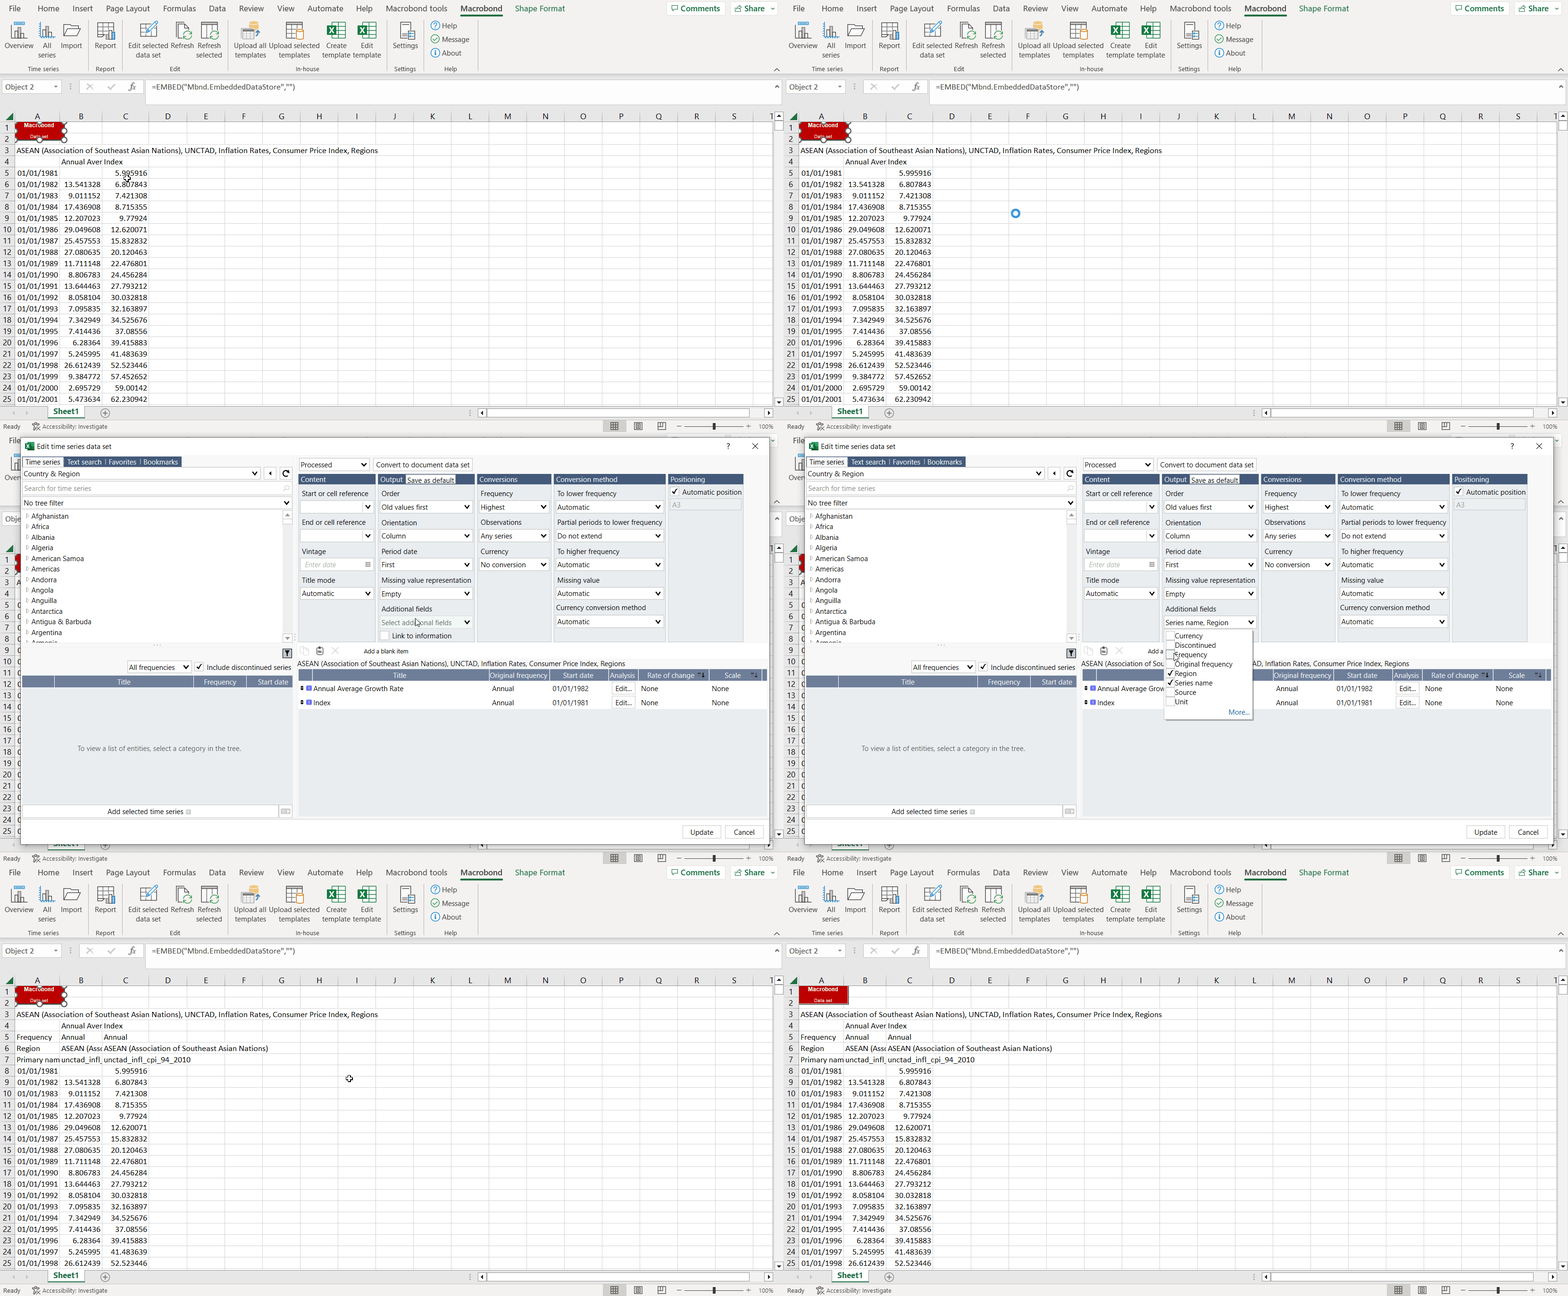
You can add metadata by right-clicking on the Macrobond data set object and clicking Edit. Click on Additional fields drop-down to select what you’d like to add from a list of the most commonly used options.
You can also access other metadata options, here. In the new window that opens, the options are organized by type.
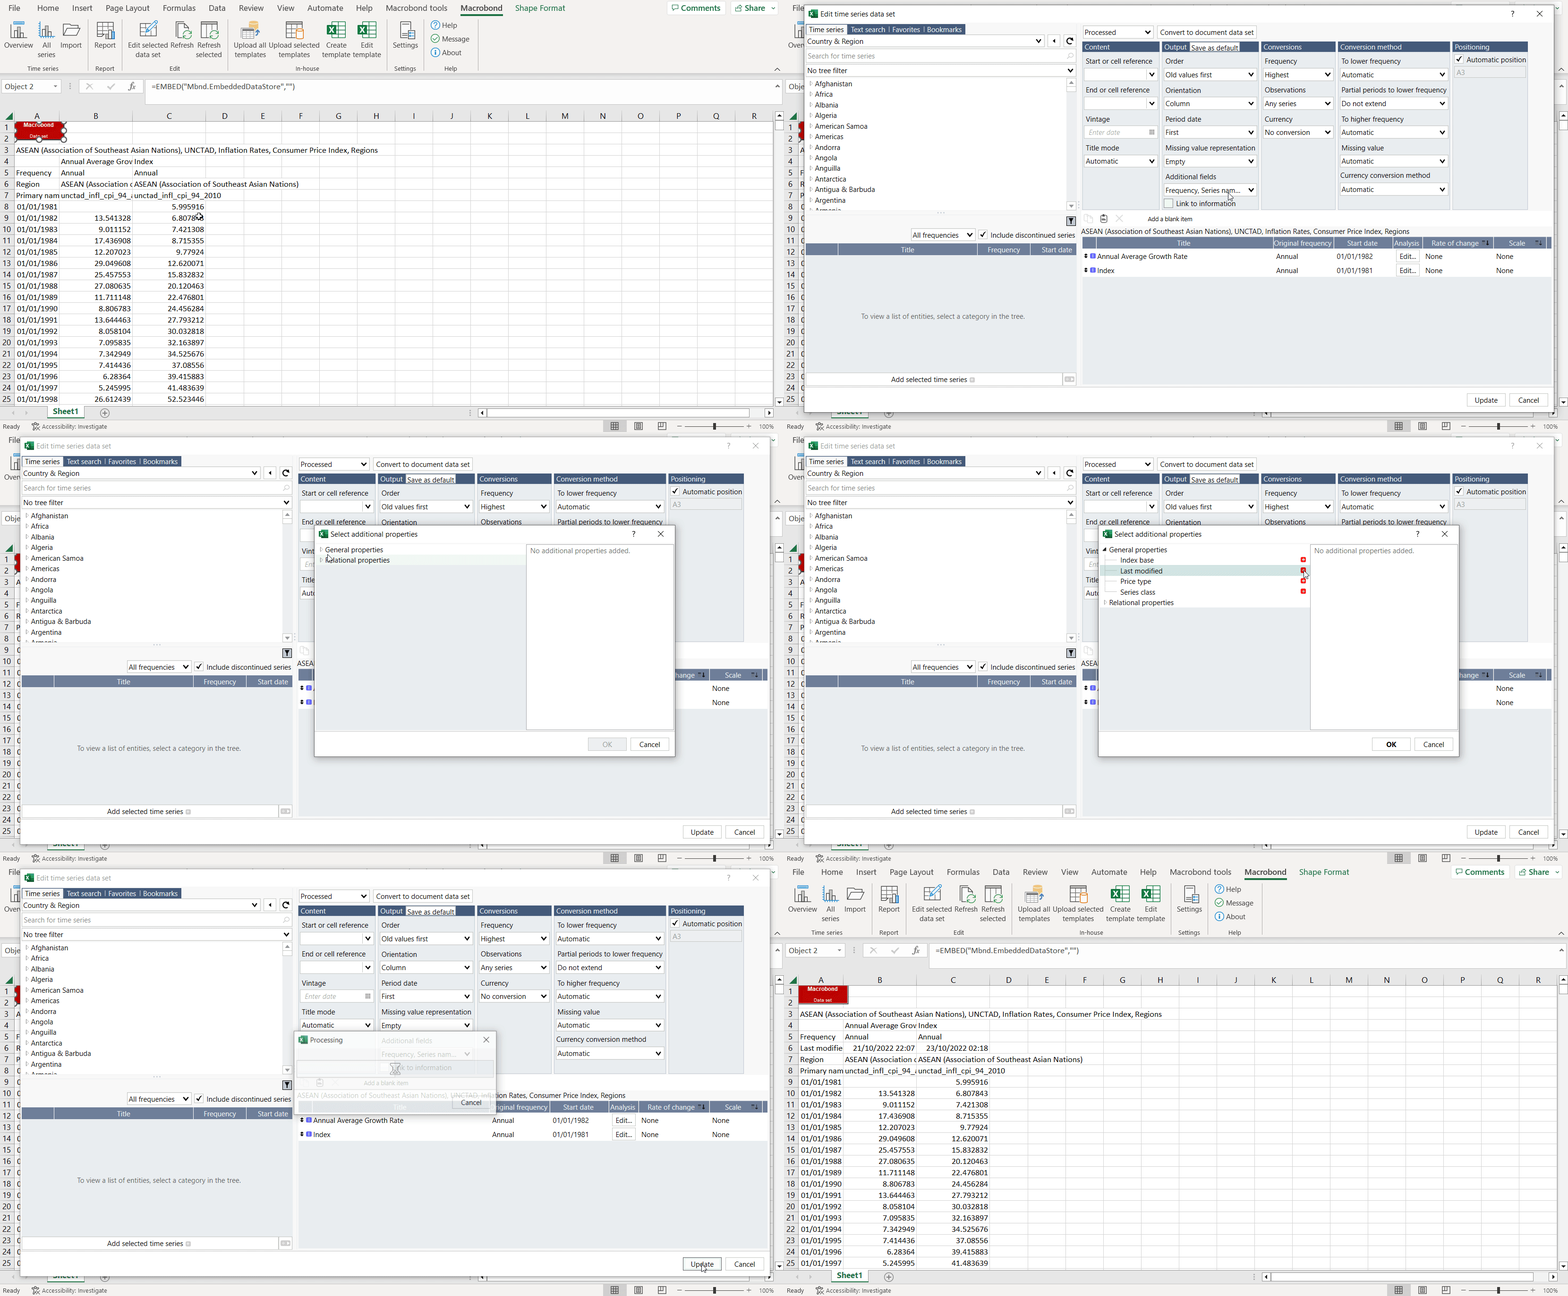
It is also possible to set a default list of metadata that will be included every time you download data to Excel. All you have to do is select the options you want and then click on Save as default.
As you may notice the all metadata is added above the time series so that it’s easy to check.
Inserting columns & rows
You might be wondering why you can’t just add your data and calculations the ordinary way in Excel. If you did add them that way, the output wouldn’t be read by the application as part of the data set and wouldn’t be maintained.
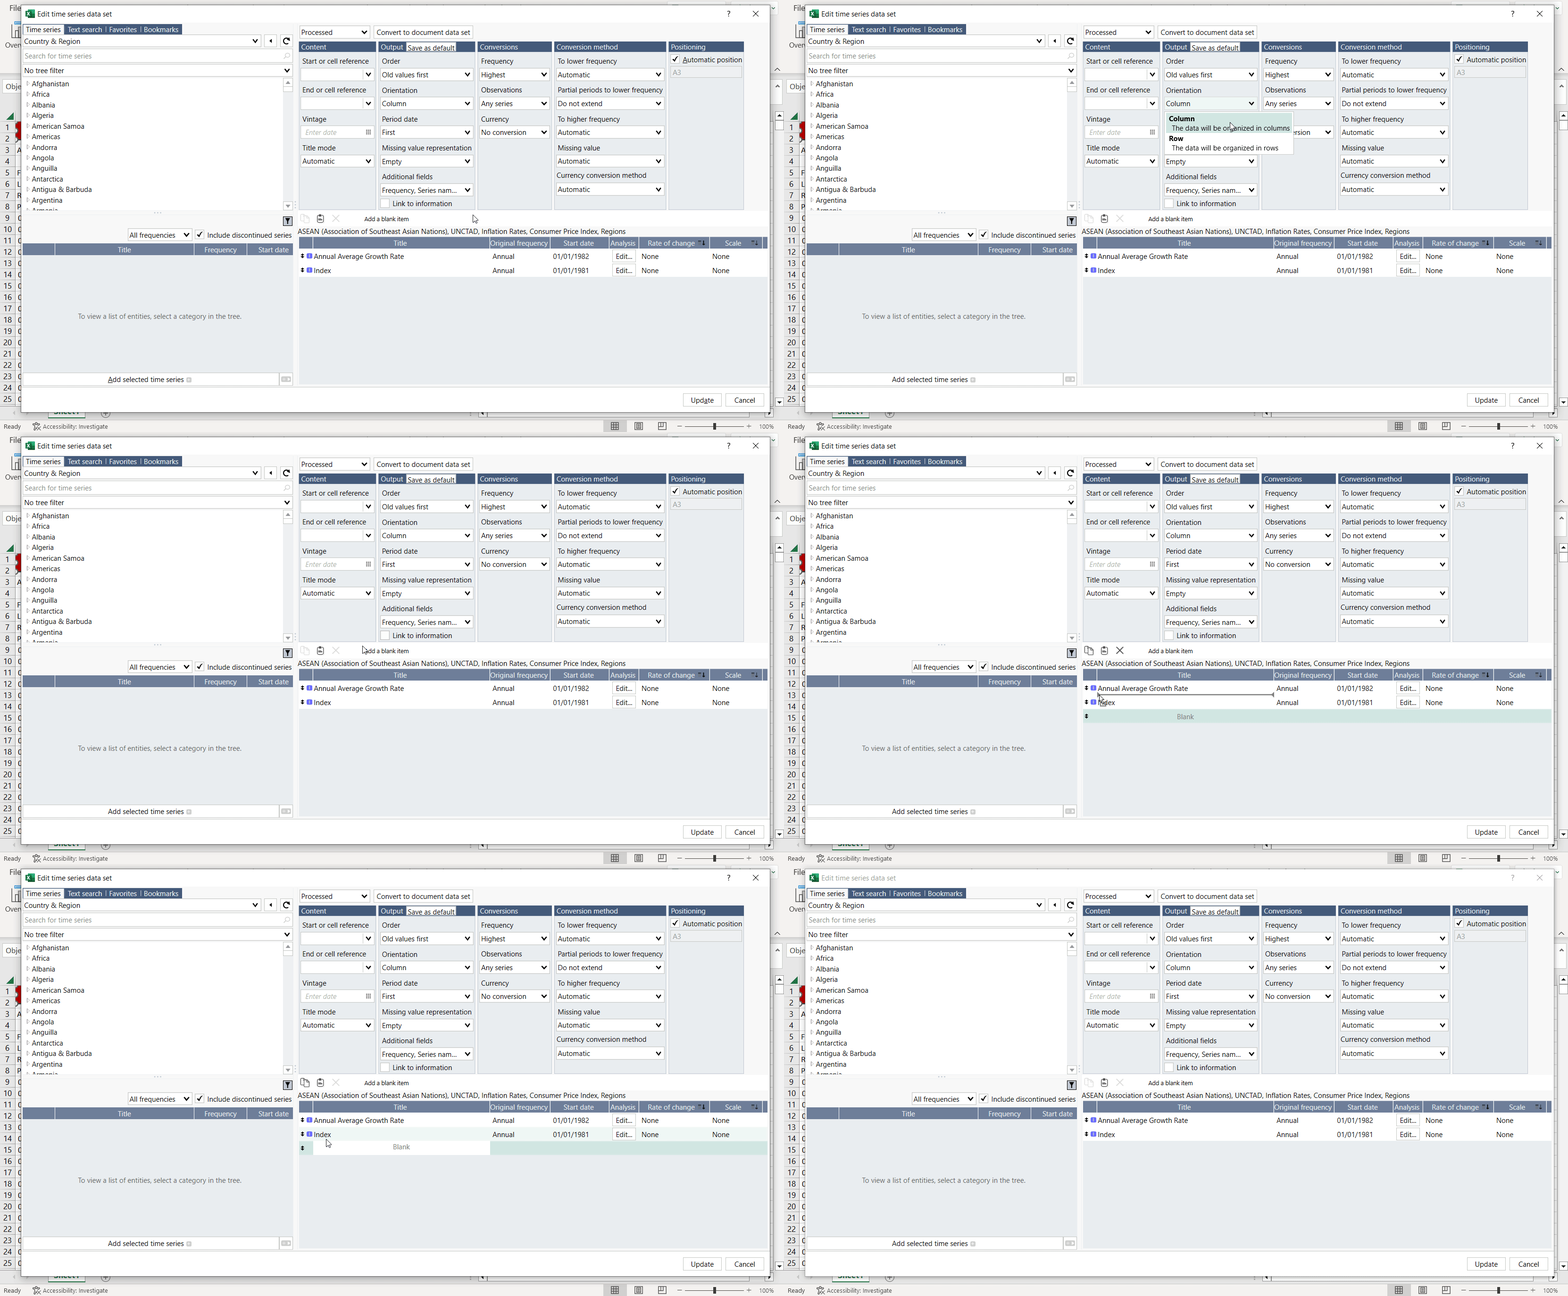
To start, you need to add empty cells where your data will be placed. Open the Edit data set window and find Orientation in the Output column. Choose Column or Row based on the orientation of your data set. To finish off, click on Add blank item button. By default, the blank column will be added at the end of the data set, If you want to place it elsewhere, simply drag it to the appropriate position.
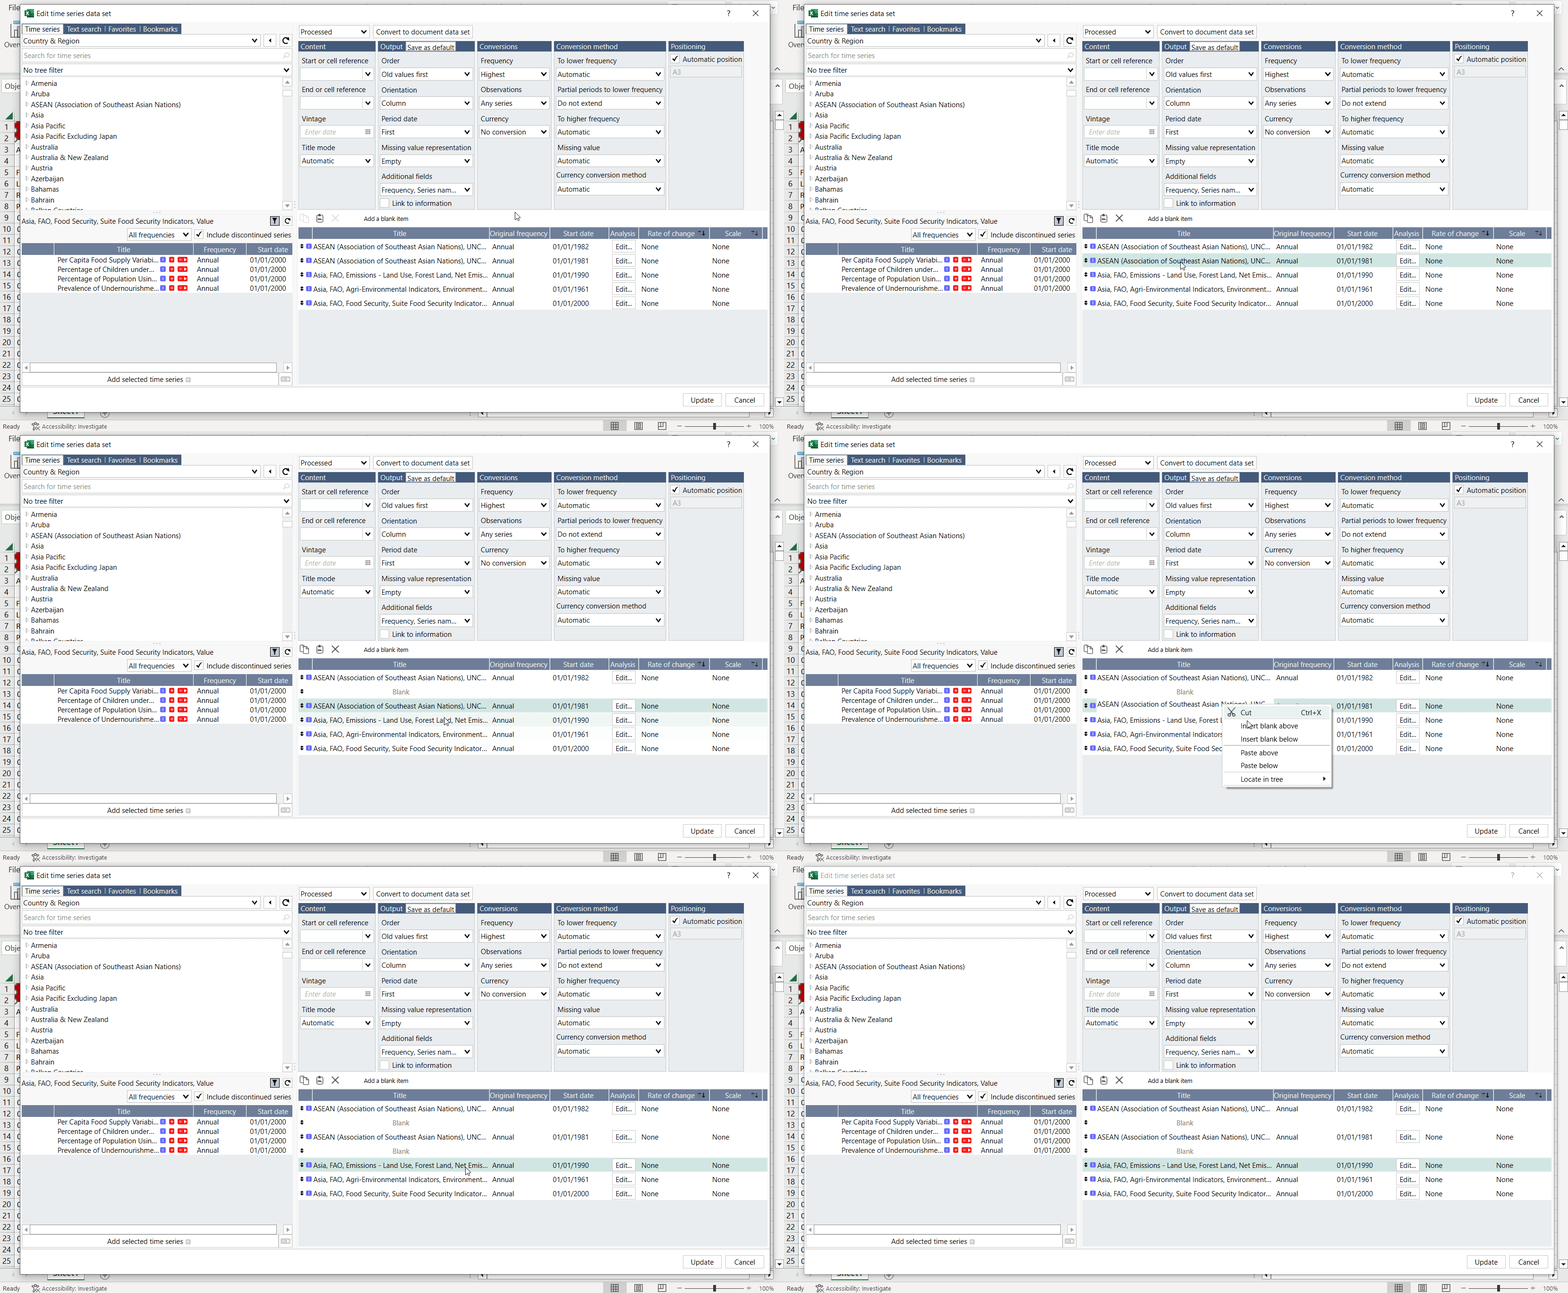
 If you need to add a lot of blank cells, or have a large data set, you might want to avoid manually dragging the columns or rows into place. To set the location before inserting them, navigate to the series basket. Select a series, right click on it and choose to insert the cells above or below this point.
 Any text, values or calculations added to the cells within these columns or rows will be maintained when you refresh the data set.
Locating series in the data tree
Locating series in the Macrobond data tree is useful when you want to find data related to a particular series you’re working with.
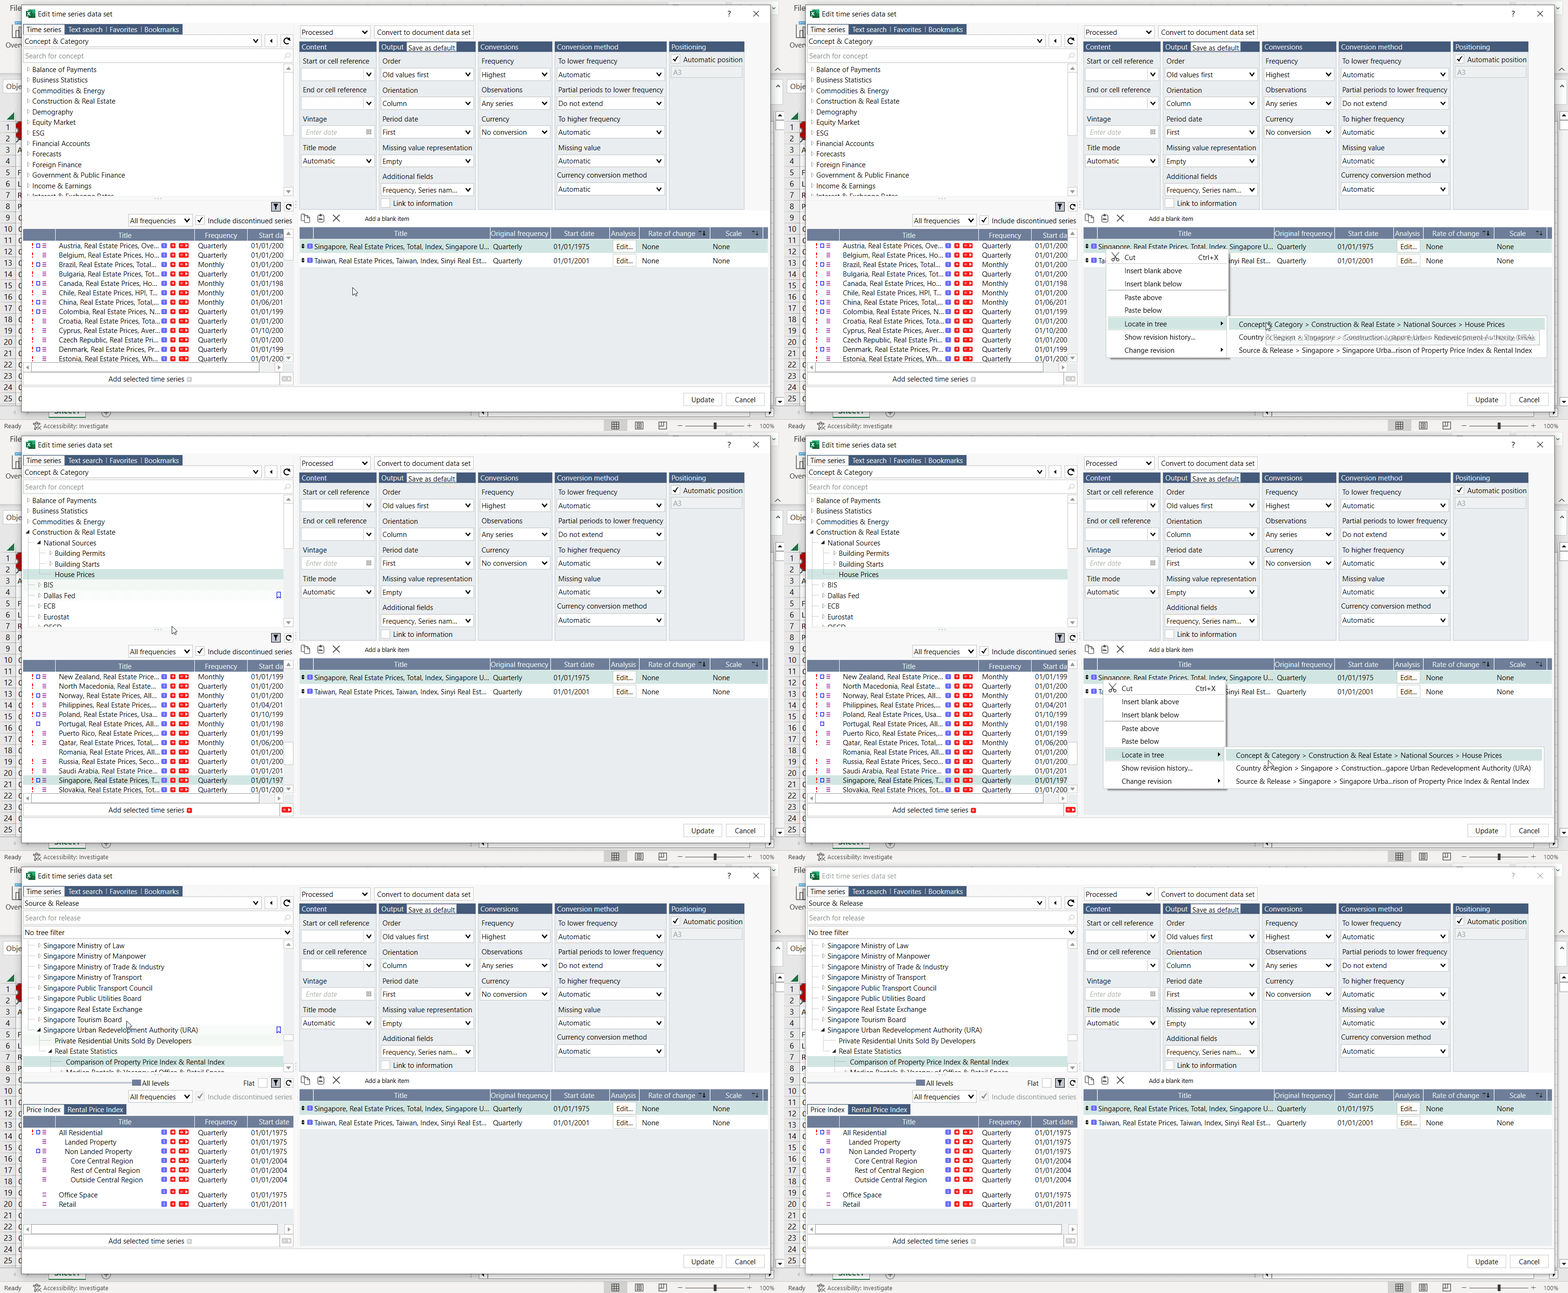
We’ll look at two examples. In the first we locate data we’ve already downloaded in the data tree to select more series. Then we go on to show you how to switch between views of the database.
Selecting more series
Right-click on one of the time series, select Locate in tree and choose the same database view we used to download the data. Let’s say that was Source & Release. Now we can browse related data from the same source.

Switching between database views
This feature can also be used to find the same series in another location in the database. Instead of having to look through the data tree from scratch for the other series, you can use the Locate in tree feature. The Concept & Category view of the database is ideal for cross-country comparisons, so right click, choose Locate in tree and select Concept & Category. Now you can simply scroll through the list to select the same series for other countries.
