
|
Meghna Shah Macro Strategist & Chief Economist Macrobond |
UK CPI will be released tomorrow early morning, let's dig a little deeper.
Why this print is important: Last week marked the US ‘soft landing’ outlook back on the table post the lower than expected US CPI release at 3%. 2 year UST yield dropped a sharp 35bps, and the market re-aligned towards one last rate hike by the Fed in July (against Fed’s own projected two steep hikes in 2023).
UK remains a different story so far: 13 consecutive rate hikes since 2021 from 0.1% to 5% on the back of elevated CPI prints, with headline still stubbornly higher than target.
CPI internals for previous release (May’2023) powered by Macrobond charts:
- Chart 1 - May CPI at 8.7% saw headline Services inflation (7.3%) rising further while Goods inflation (9.7%) stayed stubborn
- Chart 2 - Positive MoM momentum (0.7% for overall CPI) and across categories in May, no price pressures ebbing (CPI Heatmap)
- Chart 3 - Headline prints have remained elevated tracking higher contribution from both cost push as well as demand pull (boost in services consumption) factors: Spike in gas prices within Housing inflation; 2. Higher rentals, 3. Higher food & beverages inflation, 4. Restaurant and Hotel services and 5. Clothing and footwear inflation
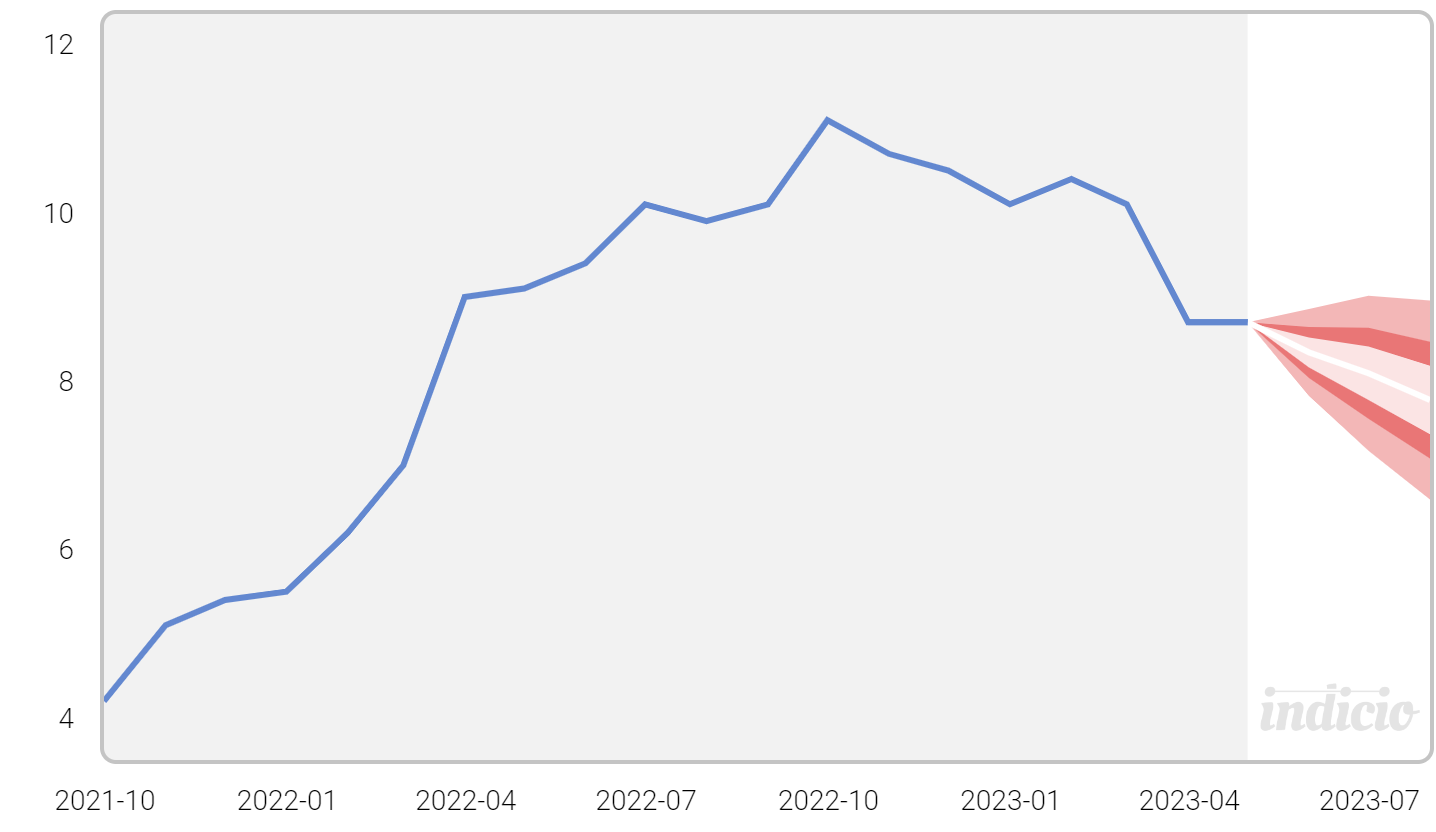
Expectations for the June data release: Estimate June CPI to be ~8.3% basis our multivariate forecast model using Indicio (Chart 4). Further CPI prints up to August likely to decelerate basis:
- BoE’s steep rate tightening cycle to impact consumption with a lag
- cost push factors post war gradually to abate
- some correction seen in House price sentiment
- base effects
BoE policy implications: June estimate at 8.3% v/s target of 2% implies BoE has more ground to cover to contain inflation before taking a policy pause
The above story through our charts:
Chart 1: May CPI at 8.7% saw headline Services inflation (7.3%) rising further while Good inflation (9.7%) stayed stubborn

Chart 2: Positive MoM momentum (0.7% for overall CPI) and across categories in May, no price pressures ebbin

Chart 3: Headline prints have remained elevated tracking higher contribution from both cost push as well as demand pull (boost in services consumption) factors: Spike in gas prices within Housing inflation; 2. Higher rentals, 3. Higher food & beverages inflation, 4. Restaurant and Hotel services and 5. Clothing and footwear inflation

Chart 4: June CPI print est at 8.3%, further softening sub 8% by September likely
Note: The Indicio model helps nowcast and merge various frequency data (daily natural gas prices, weekly gasoline pump prices, monthly wages etc).