Please Read: An update from your team at Macrobond

Quite a bit has changed recently, including the app homepage, all new branding and our second release of the year just around the corner! This post is an update from the Product Team at Macrobond with details on what’s happening, when and why…

Welcome to the first blog post from the Product Team at Macrobond! We’re going to use these blog posts going forward to keep our community updated with relevant news, updates, and to ensure you all know how to get in touch with feedback about the things you love about Macrobond (and perhaps some of the things you don’t!). 

App Start Page 

If you came to this post from the application homepage, you’ll likely have noticed some changes. 

First off, we want to acknowledge that there haven’t been many updates for a while - our apologies for that. We’re not fans of letting things go stale, but as you'll see in this post, we hit pause on a few things to focus our energy on some exciting new developments. Thanks for bearing with us. 

At the time of publication, you may also have noticed that some historical posts have disappeared from the feed. This is due to the launch of our new website and brand materials (more on that below). 

Rest assured, all the charts from our previous Charts of the Week and Blog posts are still available to you in the chart library. This has also had a revamp and a tidy up, more on that below. 

The homepage itself will continue to go through a few changes in the months ahead – we’re planning to add in new training materials as well some new features to make the app quicker and easier to navigate. If you’ve any ideas on what you’d like to see, we’d love to hear from you. Drop us a line here 

Branding & Website 

Our marketing team have been hard at work over the last couple of months updating our look and our messaging. We’ve gone for something fresh and clean but with some great colors and content to really make things pop. We hope you love it as much as we do! 

Websites & Style Sheets 

The first major thing you’ll notice is the corporate website (www.macrobond.com) has completely changed. I won’t list the changes as it’s a ground-up re-write so basically everything has changed 😊 

Something else you may have noticed is the in-app branding, specifically the default style sheet has also changed. Anywhere you’re using the default style sheet (rather than your corporate one), you’ll notice the Macrobond logo and the chart colors for your existing charts have all been updated to match the new branding. If you notice any issues, our support team are there to assisthttps://redir.macrobond.com/go/support  

Finally, release notes and help.macrobond.com. As well as the corporate website changing we’re also working on overhauling our help site. As part of those changes, our release notes will now be published on the technical help site, rather than the corporate site as we felt this was the more logical place for them to live. 

We’ll keep you updated as plans evolve for further changes to the help site but we’re looking at everything from improved navigation, to content and training, better search capabilities, more video and tutorial content and of course, AI helper agents. 

Again – all thoughts and ideas appreciated you can reach us here 

Content 

Another hot topic in the community has been Charts of the Week, or rather, the lack thereof. The decision to stop publishing CotW earlier wasn’t taken lightly. We know lots of our community found the posts useful, but we also felt it was time to change things up a bit. So, whilst we’ve taken down one publication, we’re going to replace it not with one, but with five new initiatives! 

  • Macro Trends –A monthly review of the top economic themes paired with charts and thought leadership from the Macrobond team. 
  • Macro Charts – A weekly chart publication highlighting the week’s major economic releases. 
  • Macro Moves – The one you all demanded most – A monthly publication featuring charts from the top 10 most used data sets on the platform. 
  • Macro Segments – A monthly chart pack with insights tailored to your individual business domain. 
  • Ask Macrobond – Another monthly publication featuring the most requested charts from our community. We’ll be running polls on LinkedIn to capture your thoughts, keep an eye out and get your voice heard! 

 Chart library changes 

The chart library is an invaluable resource and something many of our users utilize regularly. It contains charts and publications going all the way back to 2019 as well as training materials and chart packs for specific geographies and sectors to get people going quickly with key data and charts. However, after six years of updates, we felt it was time for a bit of a tidy up. 

So, our content team have been hard at work reviewing everything and we’ve made some changes to make the organization cleaner and simpler to navigate as well as removing out-of-date content. Those changes will go live with the upcoming release on June 2nd 

One important note – if you have links to any of the charts in the Chart Library embedded in PowerPoint / Excel or Word documents, those will need to be updated to reflect the new chart location in the chart library. This will also apply to anything you’ve cross-linked into a website or other distribution platform. 

Any concerns, please contact our support team via https://redir.macrobond.com/go/support and we’ll assist. 

New Release 

Last but by no means least, we have our second release of the year coming soon. We’re targeting Monday June 2nd for the update to go live so keep an eye out for the in-app banner notifying you of the new version. 

As always, there will be full release notes on the day but a couple of teasers – we’ve added SSO support so no more email and passwords and we’ve made improvements to the data search and navigation including popularity indicators for different series. There’s also a raft of updates and additions to our data content and API’s. More on all that soon… 

If you managed to read all the way to here, then my thanks for your attention, I hope that was informative and useful reading. 

I’ve dropped the link a few times already but we really do value your thoughts and input so please do feel free to drop us a line here with any requests or insights. 

Thanks! 

Dan Seal 

Chief Product Officer, Macrobond. 


Who ‘MOVE’d My Cheese?

Embracing Change in Bond Markets.

Meghna Shah
Macro Strategist & Chief Economist
Macrobond

All opinions expressed in this content are those of the contributor(s) and do not reflect the views of Macrobond Financial AB. All written and electronic communication from Macrobond Financial AB is for information or marketing purposes and does not qualify as substantive research.

In Spencer Johnson’s classic, “Who Moved My Cheese?”, the theme is simple yet profound: “Change is inevitable, and adapting is essential”. This concept resonates deeply with the bond markets today, where volatility has surged due to a confluence of geopolitical, fiscal and monetary factors. October was particularly eventful, marked by a sharp rise in bond yields as investors faced heightened uncertainties from key political and policy outcomes scheduled this week. The U.S. 10-year Treasury yields spiked by 50 basis points, with other developed market (DM) bond yields following a similar path. While equities in developed markets consolidated, bond markets reacted, with pronounced sell-offs in major DM bond indices.

Build-Up to the Election and the volatility

Since Harris’s nomination in July, bond markets have reflected the “Trump trade” in the lead-up to the election, with yields and the dollar index closely following betting prices of a Trump victory.

1. USD Dollar

The dollar index echoed strength, resembling the dollar rally that followed Trump’s 2016 win.

2. Treasury Yields

Yields have climbed, largely due to concerns over worsening fiscal health and inflation risks. Factors such as potential tariff impositions, retaliatory measures, proposed tax cuts to boost consumer sentiment, and an outlook for expansive government spending are all fuelling these expectations.

Recent yield trends suggest that the market’s anticipation of limited fiscal restraint and persistence of inflationary risks, are getting priced in to some extent, regardless of who wins the presidency.

October’s yield surge: Disseminating the MOVE Index Spike 

The October 2024 data from the MOVE index, which tracks bond market volatility, reveals a significant increase in volatility compared to last year. When regressed against the 10-year yield, October 2024 data points lie above the trend line as well as above October 2023 levels. In October 2023, the U.S. 10-year yield touched 5%, reflecting widespread acceptance of the “higher for longer” interest rate narrative—a shift that became the new norm. This recent spike in market volatility and the yield movement suggest, investors are navigating an environment of heightened uncertainty led by numerous drivers.

Decoding Yield Components: Short-Term Rate Expectations and Term Premium

To understand yield volatility and trends, yields can be decomposed into:

1. Short-Term Rate Expectations

This reflects market expectations for near-term policy rates, which are largely aligned with central bank policy rate and anticipated rate adjustments.

2. Term Premium

This is the additional return investors demand to hold longer-term bonds, compensating for risks related to credit, liquidity, interest rates and other factors associated with holding duration. The term premium is especially sensitive to economic uncertainty, amplifying yield volatility as investors adjust their risk assessments.  

Assessing Short term rate expectations

Monetary policy expectations continue to evolve, remaining closely tied to the Federal Reserve’s dual mandate of stable prices and maximum employment. So far, the Fed has managed a “soft landing,” keeping the U.S. out of recession. However, recent data—such as consumer spending, employment figures, and ISM indexes—show signs of slowing momentum.

Adding to this outlook, many proposed policy agendas from the presidential candidates carry potential inflationary risks. When regressed over the last years, regardless of political and policy changes, U.S. inflation (CPI) has on average trailed M2 money supply growth by about 24 months. The Fed’s restrictive monetary policy and rate hikes since 2022 have successfully curbed inflation this year. However, M2 growth, which dropped to -2.2% in January 2024, has since rebounded to 2.6% by September 2024. This resurgence in M2 growth could sustain upward price pressures, with inflation potentially rising again after a lag.

Core CPI could likely stay elevated, remaining above the Fed’s 2% target, which could keep the base yield curve higher and maintain wider yield-inflation differentials. Historically, similar wide differentials have occurred during periods of strong growth and policy adjustments, such as the robust growth phase of 2006-2007, expectations of policy tightening around 2010, the "taper tantrum" in 2013, and the Fed’s balance sheet reduction in 2018.

The scope for monetary policy adjustments depends on reaching a neutral rate (r*) that supports trend growth while closing the output gap to achieve target inflation levels. According to the HLW estimate, the output gap stood at a positive 0.1% for Q3 2024. In pursuit of a soft landing and with evolving growth inflation risks, markets have recalibrated expectations for monetary easing in H2 2024 and 2025.

Assessing Term premium sensitivities

The recent month-over-month yield spike of over 50 basis points reflects a notable increase in the term premium investors demand. In addition to the marginal increment in short term rate expectations, both the ACM and KW models from the Federal Reserve indicate a rise in term premium. This has stemmed from heightened debt levels, which challenge the market’s capacity to absorb supply and from policy uncertainty as investors struggle to assess shifting macroeconomic dynamics.

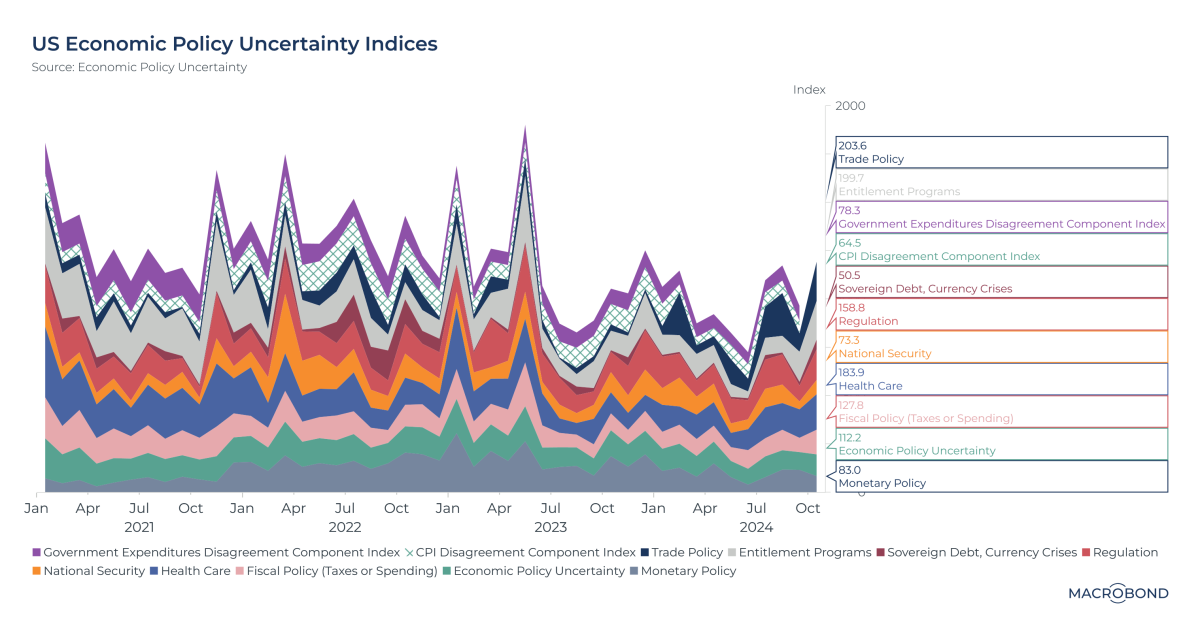
The increase in the underlying term premium and the associated volatility is driven by pricing risks linked to a wide range of uncertainties. These range from broader risks like a potential sovereign debt crisis to more niche indices tracking as ‘entitlement programs’ and ‘national security’.

Additionally, the Economic Policy Uncertainty index has shown significant widening in its components, particularly in "Trade Policy" (203.6) and "Fiscal Policy" (127.8). These trends largely reflect the growing bets on a Trump victory throughout much of October.

Directionally, the term premium tends to remain sticky for a quarter until greater clarity emerges on the underlying sources of uncertainty (structural measures/policy response). At present, the outcomes of the upcoming election, particularly with respect to the control of the House and Senate, will be crucial for the implementation of proposed agendas and their potential impact on yields. A Red sweep can further portend higher term premium with trade escalations as seen in the chart above.

Bond market embracing change: Higher term premium, higher volatility

Markets are currently pricing in a bear steepening of the yield curve, driven by expectations of calibrated monetary policy easing that affects the shorter end, while concerns over above-target inflation and increased debt supply weigh on the longer end. However, the backdrop of this political and policy transition is characterized by entrenched persistence of higher term premium and increased volatility, emanating from the multiple uncertainties and their correlated outcomes.

Can upcoming CPI justify BoE policy easing expectations in June?

UK policy rate decision scheduled for 20 June will be influenced by two upcoming inflation reports. Current consensus and market pricing indicate a 60% probability of a rate cut. However, this decision remains a close call, contingent on the data from these two inflations releases.

Meghna Shah
Macro Strategist & Chief Economist
Macrobond

All opinions expressed in this content are those of the contributor(s) and do not reflect the views of Macrobond Financial AB. All written and electronic communication from Macrobond Financial AB is for information or marketing purposes and does not qualify as substantive research.

Macro backdrop

Recent macroeconomic data for the UK economy have shown some softening in the labour market with the unemployment rate rising to 4.3% in Q1 2024 from 3.8% in October-December 2023. Wage growth remains elevated at 5.9%, which does not provide sufficient comfort for a rate easing.

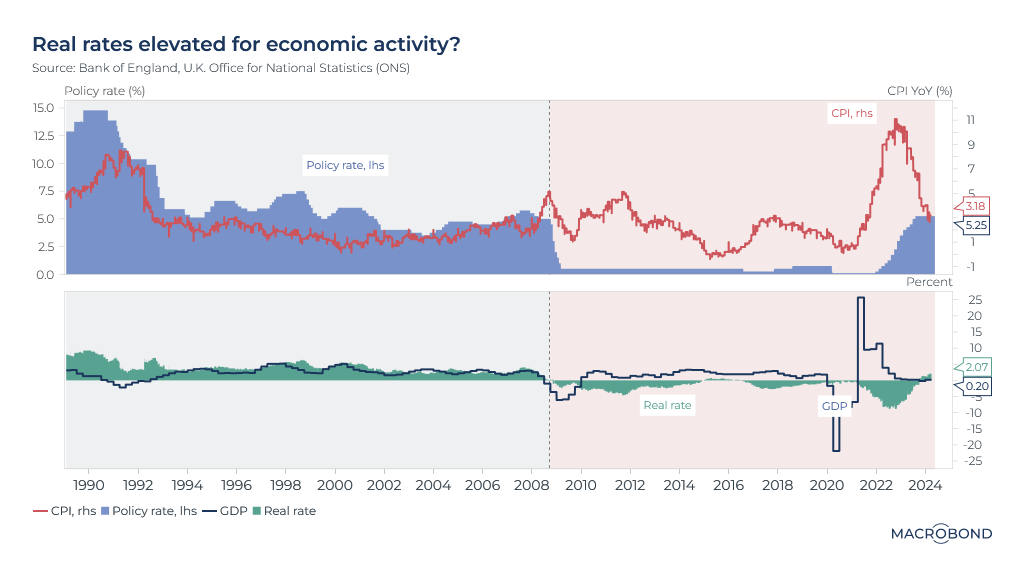
Real rates turned positive starting in October 2023 and economic activity has since decelerated sharply, with Q4 2023 GDP contracting by 0.2% year-over-year.

Focus of the Week

The UK CPI release this week is likely to show a sharp deceleration in the headline figure, bringing it closer to the expected target. This would result in even higher real rates, potentially further dragging on sentiment, as has been observed since the Global Financial Crisis.

Inflation Drivers for April’s release

The April CPI is forecasted to be around 2.2%, down from 3.2% in March, with the consensus at 2.1%. A significant factor in this sharp decline is the announced reduction in the Ofgem price cap for energy prices. This 12% reduction in the cap is expected to lower both the electricity and gas price indices.

A gradual slowdown in inflationary pressures is also evident from high-frequency debit and credit card spending, which are key indicators of economic sentiment and inflation trends.

'Delayable' spending currently at ~75 (with pre-COVID levels set at 100) is significantly lower than the average of 88 seen in 2021 and 2022, even after accounting for seasonality. The higher levels in 2021 and 2022 reflected greater confidence in the economic situation, supporting discretionary spending and contributing to demand-led inflation.

Conversely, 'staples' spending had remained elevated in 2021 and 2022, indicating sustained cost pressures, particularly in food and energy prices. The current level at 113 can also be an indicator of ‘staples’ impinging on ‘delayable’ spends amidst the economic slowdown.

Indicio model forecasting for CPI

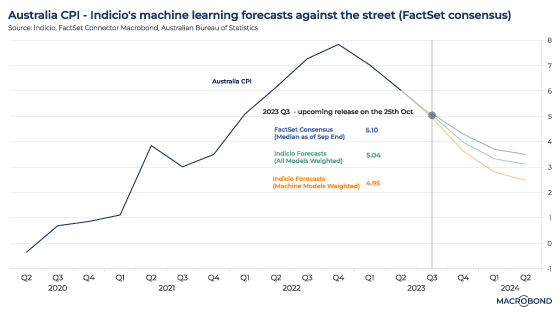
Taking into account multiple hard data points, soft survey lead indicators, and high-frequency alternative data related to wage growth, consumer confidence, and cost price pressures, we run several multivariate models on the underlying data to forecast CPI. The individual estimates from the various models range from 1.65% to 3.5%.

We consider the top three models evaluated for having the lowest RMSE (Root Mean Square Error) measurements. An accuracy-based weighting assigned to these top three models predicts a CPI release of 2.2% for April 2024. The sharp drop in Ofgem prices helps bring the headline CPI closer to the expected target. However, the reversal of base effects in H2 2024 keeps the market skeptical. This skepticism is reflected in the yield curve at the shorter end where 1-year and 2-year yields, though inverted, remain elevated.

Note: This chart requires an Indicio Technologies license.

Fed caution aligned with inflation internals, core PCE likely to be sticky


Meghna Shah
Macro Strategist & Chief Economist
Macrobond

All opinions expressed in this content are those of the contributor(s) and do not reflect the views of Macrobond Financial AB. All written and electronic communication from Macrobond Financial AB is for information or marketing purposes and does not qualify as substantive research.

The Federal Reserve's latest meeting minutes underscored a cautious approach towards reducing interest rates too quickly, especially given the persisting tightness in the labour market and the yet-to-be-confirmed indications that inflation is on a consistent downward trajectory. This careful stance seems well justified when examining the internals of inflation and their alignment with the Fed's perspective.

Delving into inflation internals

By leveraging insights from Indicio and considering various factors, the US Core Personal Consumption Expenditures (PCE) Price Index for January 2024 is projected at 2.85%, slightly down from 2.9% in December 2023. However, the month-over-month increase is estimated at around 0.4%, higher than the 0.2% rise observed in December. This nuanced analysis sheds light on the intricate dynamics influencing inflation.

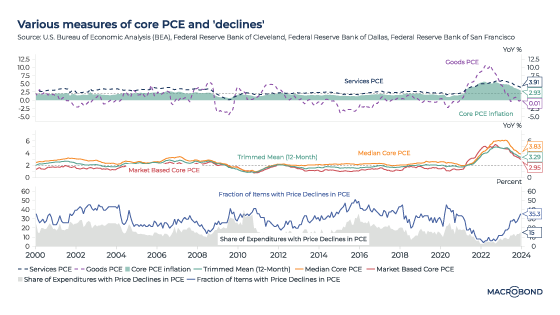
Various measures of core PCE and its composition

In December, Goods PCE was almost at 0, while Services PCE surged to 3.91%, pushing the overall core PCE to 2.9%. Other measures, such as the Cleveland Fed median inflation at 3.8%, the Trimmed mean 12-month at 3.3%, and the BEA’s market-based PCE at 2.95%, all hover above the Fed's 2% target. This suggests that, despite the slight decline, inflation pressures remain.

Expenditure and price decline dynamics

The discrepancy between the share of expenditure with price declines in PCE at 15% and the fraction of declining items in PCE at 35% highlights the stickiness in core inflation and the challenges in steering it towards the target.

Cyclicality of inflation trends

The disparity between cyclical inflation at 5.4% and non-cyclical inflation at 1.5% in December underscores the dominant contribution of recent cyclical factors to the core PCE of 2.9%. Factors such as robust growth momentum, tight labour market conditions, and resilient consumer spending have exacerbated the cyclical component of inflation.

Supply and demand driven inflation factors

Initially spurred by a supply shock, the inflationary cycle quickly transitioned into a demand-driven inflation phase, fuelled by substantial fiscal spending post-Covid. As supply chain disruptions began to ease, it became evident that demand-driven factors, evident in ‘Services’ inflation would need to be moderated to achieve the Fed's 2% inflation target.

Core PCE forecast for January 2024

Using a variety of indicators related to economic growth, labour market dynamics, earnings, government spending and the real estate sector, Indicio employs multivariate models to forecast Core PCE. Adjustments and transformations facilitated by Indicio allow for rapid estimation through multiple models. The analysis points to earnings growth as a significant driver of Core PCE, with month-on-month momentum expected to rise to 0.4% from the previous month's 0.2%. The forecasted year-over-year core PCE of 2.85% for January remains elevated, indicating ongoing inflationary pressures.

In conclusion, the Fed’s caution in adjusting interest rates is well-founded, with inflation internals suggesting a complex interplay of factors that require careful monitoring and management. The analysis underscores the challenges in achieving and maintaining the Fed's inflation target, highlighting the need for a nuanced approach to monetary policy.

Modeling how German inflation might be easing with Indicio

Our economist examined price pressures in Europe’s economic engine.

Meghna Shah
Macro Strategist & Chief Economist
Macrobond

All opinions expressed in this content are those of the contributor(s) and do not reflect the views of Macrobond Financial AB. All written and electronic communication from Macrobond Financial AB is for information or marketing purposes and does not qualify as substantive research.

The German economy has faced headwinds through 2023, with a backdrop of sustained inflation and higher borrowing costs. The market is expecting a reversal of this trend, with steadily decelerating inflation making room for a more accommodative stance by the European Central Bank in 2024 and beyond. 

To generate a prediction for German inflation figures that are due on Nov. 29, we used our partnership with Indicio Technologies. We deployed univariate and multivariate forecasting techniques that incorporated food, fuel and core inflation category indicators. 

We also chose consumer confidence as an input parameter to gauge the underlying demand conditions – this indicator has been waning amid Germany’s economic challenges.

Our model calls for the consumer price index to rise 3.7 percent year-on-year for November, slowing slightly from the 3.8 percent pace in October.

To consider the backdrop to our forecast, the following charts analyse the components that have been contributing to inflation.

The inflation story so far

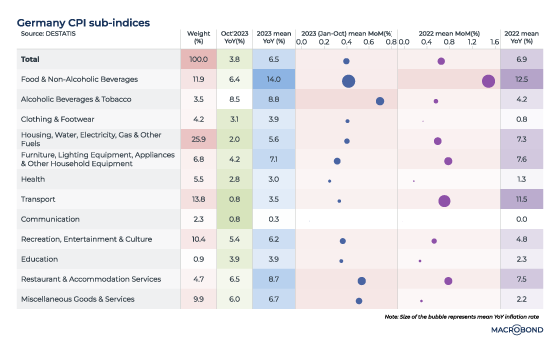
Our first visualisation plots inflation trends in the various CPI sub-indices, comparing October year-on-year figures to the 2023 and 2022 year-on-year averages. The table’s wider columns track month-on-month averages for the various categories; bubble size represents the average year-on-year pace. 

Diverse supply- and demand-side factors have impacted CPI trends for Germany over the past two years. Cost-push pressures – primarily in food and fuel – surged after Russia’s invasion of Ukraine. 

Since then, inflation has cooled off swiftly, helped by a decline in wholesale energy prices and government policies that aimed to shield consumers.

The contribution to headline inflation from major categories, such as the housing and utilities bucket (with a weighting of 25.9 percent in the CPI) and transport (a 13.8 percent weighting) has come off sharply. October inflation for these two segments slowed to 2 percent and 0.8 percent respectively.

Food inflation is lingering, however. Disruption in food supply chains is being accentuated by the tightness in the labour market, keeping costs elevated for food processing, restaurants and supermarkets. The “food & non-alcoholic beverages” and “restaurant & accommodation services” buckets are among categories with the worst inflation, both in October and for 2023 as a whole; the food and drink category’s bubble size and rapid month-on-month advance is also notable in 2022.

The evolving macro dynamics have seen the transmission of higher input costs into services, as our next chart shows -- breaking down the respective contribution of goods and services to headline inflation. The elevated goods inflation of 2022, coupled with a rise in wages, has resulted in sticky core inflation.

It’s worth noting how the green “services” band has gradually widened. At its October 2022 peak, goods inflation contributed 7 percentage points to inflation, while services contributed just 1.8 percent. But the October 2023 print indicates that services contributed 2 percentage points to inflation – exceeding the 1.8 percent contribution from goods.

That’s important because services inflation tends to be sticky, and the deceleration towards target is likely to be slower. 

Watching the markets: the CPI vs. two-year yields

The International Monetary Fund is forecasting that German CPI will slow to 3.5 percent in 2024 and 2.2 percent in 2025 – still above the central bank’s 2 percent target. 

As for the markets, Euro STR futures are pricing in the first ECB rate cut by the second quarter of next year. In bonds, one-year German debt started out-yielding its two-year equivalent almost a year ago, as our chart shows; i.e., the inversion began right around the time that inflation peaked.

The inverted yield-curve corridor, in grey, indicates that even lower interest rates (tracking lower expected inflation) are expected two years down the line. 

We have also added, in bold, the 3.7 percent November CPI forecast that we generated with Indicio -- flanked by various confidence intervals. Monetary policy transmission is effective with lags and getting to target inflation can take longer. 

The ECB assesses this cycle’s slowdown with a “pause” likely

Our economist examines Europe’s slowing but persistent inflationary pressures.

Meghna Shah
Macro Strategist & Chief Economist
Macrobond

All opinions expressed in this content are those of the contributor(s) and do not reflect the views of Macrobond Financial AB. All written and electronic communication from Macrobond Financial AB is for information or marketing purposes and does not qualify as substantive research.

The European Central Bank is meeting this week and an interest-rate pause is priced into the markets. This follows the 25-basis-point hike in September, when economists were split on whether the “pause” would kick in.

The ECB has tightened by a cumulative 450 basis points in this cycle. It’s aiming to keep policy at restrictive levels for long enough to ensure that inflation returns to its 2 percent medium-term target in a timely manner. 

An outlook for slower growth 

The ECB’s last hike was at odds with its peers. The Federal Reserve and Bank of England both “paused” in September to gauge how their previous tightening was being transmitted into the economy. (Both of those central banks also adopted a “data-dependent” stance, which will see them assess how inflation pans out before making more hikes.) 

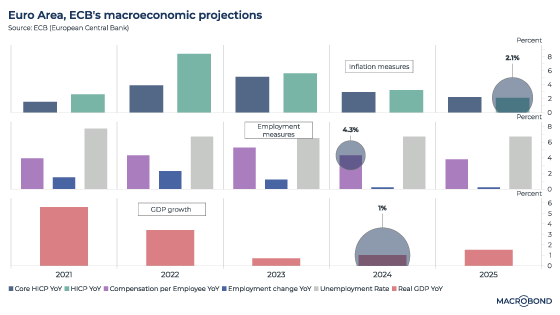
The ECB also lowered gross domestic product projections for 2023, 2024 and 2025, as the next chart shows. It also includes the central bank's latest projections for different inflation measures, as well as employment metrics.

It’s particularly notable that the ECB cut its 2024 GDP estimate by 50 basis points to 1 percent. The central bank projects that it will likely (almost) reach its inflation target by the end of 2025.

One central bank, many countries 

The ECB faces a dilemma not shared by its UK and US peers; it makes policy for 20 different nations in the eurozone, and some of these countries are experiencing different economic dynamics. Spain, for example, remains supported by its services sector. 

However, steep tightening, elevated policy rates and the increased cost of borrowing are leading to a gradual growth deceleration overall – and this is especially evident in the industrial sector. Germany and France are seeing a sharp contraction in manufacturing sentiment. 

The risk of a sharp slowdown in the eurozone has increased substantially. The latest business surveys are already pointing to contraction in both services and manufacturing activity, as the next chart shows; the EU purchasing managers indices (PMIs) remain below 50.

Inflation – and, more so, growth – are both surprising on the downside

The next chart looks at “surprise” indices from Citigroup that track whether economic or inflation data releases in the eurozone are beating or trailing expectations. 

In all cases, the arrows are pointing down. But the economic surprise index is at minus 54, compared with minus 4 for its inflation equivalent.

Our next chart measures the cost of borrowing, as measured by the ECB. As the second pane indicates, after many years of ultra-low rates, borrowing costs have moved swiftly higher for both households (financing their home purchases at 3.85 percent) and non-financial corporations (which can borrow at about 5 percent). 

The top pane compares long-term to short-term borrowing costs. This indicator is currently steeply inverted (negative 107bps compared to a 20 year average of positive 19bps); this suggests that near-term investments will likely continue to see a drag.

Governments are also likely to tighten the fiscal strings amid a backdrop of their own growing interest cost burden. This, too, may impact consumption demand ahead. 

These trends add up to a likely struggle for the eurozone’s economy over the next 12 to 18 months.

Meanwhile, the job market seems to be staying tight 

Pressures on core inflation are supported by continued tight labour markets and positive wage growth. To illustrate this, the next visualisation (a scatter chart) is a Phillips curve for the EU, tracking the relationship between unemployment and inflation. 

The curve was relatively flat (with a slope of 0.19 for the mean) from 2000-2020. The mean unemployment rate was 9.3 percent and inflation was 1.8 percent. But the Covid and post-Covid era has seen a much steeper slope (0.76), with mean unemployment rate at 6.7 percent and inflation at 5.1 percent.

The ECB’s own projections for wage growth (4.3 percent in 2024) and the unemployment rate (still 6.7%, staying well below that 2000-2020 average) indicate that the labour market will weaken only gradually. That limits meaningful downslide in near-term core inflation: the ECB’s projection stands at 2.9 percent for 2024.

Money supply and energy prices 

The ECB’s cumulative interest-rate and balance-sheet tightening is shrinking M3 growth – measure of the broad money supply in economy.

M3 growth has broadly led inflation trends, with the highest correlation at a 22-month lag observed over the last two decades.

Indeed, inflation has come down a long way from the 10 percent levels shown in this chart. Falling energy prices and favourable base effects account for much of this slowdown; energy prices peaked in October 2022. 

However, the next leg of deceleration may be slower given sticky core inflation. Services inflation can tend to keep overall inflation sticky for a longer period of time, and that has been factored into the consensus expectations.

The ECB’s policy decision – and beyond: watch for a longer pause 

Given that the ECB expects inflation to stay above its target through 2024 amidst those tight labour markets, the central bank may choose to keep policy rates restrictive enough to contain demand-led inflationary pressures – even as growth falters. 

So while policy rates may have reached their peak for the current cycle, an extended duration of these elevated rates may be the ECB’s indirect policy tool to manage inflation expectations. Rising long-term bond yields reflect the fact that the market’s rate-cut expectations have been pushed out towards the fourth quarter of 2024.

As John Major said about his own battle with inflation when he was Britain’s finance minister in 1989: “If it isn’t hurting, it isn’t working.” 

Assessing scenarios for oil amid unrest in the Middle East

Our economist Meghna Shah analyses the impacts of a Saudi supply disruption, utilising Indicio to model her forecast. The blog explores potential implications for emerging markets, which are known for being significant oil consumers, along with the trickle effect into inflation as the world struggles with escalating commodity prices.

Meghna Shah
Macro Strategist & Chief Economist
Macrobond

All opinions expressed in this content are those of the contributor(s) and do not reflect the views of Macrobond Financial AB. All written and electronic communication from Macrobond Financial AB is for information or marketing purposes and does not qualify as substantive research.

Hamas' assault on Israel came as a geopolitical shock. As the situation escalates, potentially drawing in other players in the Middle East, there are implications for crude-oil prices. 

This blog examines the oil market’s geopolitical linkages and the potential for supply disruptions.

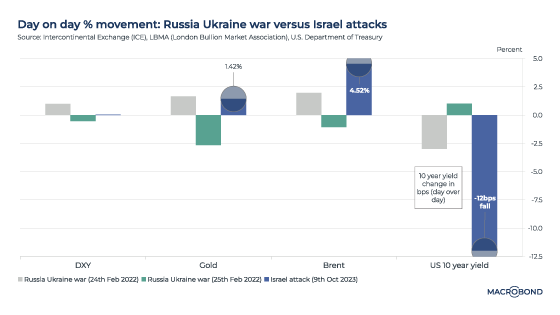
Early market reaction was stronger than Russia-Ukraine in 2022

The Monday after the attacks saw an immediate reaction in the market for commodities and safe-haven assets. 

Crude-oil prices jumped by about 5 percent. Gold rose 1.5 percent. And US government bonds rose, with 10-year yields falling about 12 basis points. These sharp market movements give a glimpse of the uncertainty being priced into this conflict. As our first chart shows, these moves were stark when compared to the first two trading days after Russia invaded Ukraine last year. (To be sure, market reactions in other assets were relatively contained; the S&P 500 initially sold off, but quickly reversed). 

Turning to the options market, there was a steep decline in the ratio of put volume versus call volume for the West Texas Intermediate (WTI) oil price, as the second panel of the next chart shows. This is indicative of upward price risks. 

A put/call ratio below 1 implies there are more expectations of a price rally versus a drop. On Monday, the put/call ratio dipped sharply to about 0.4 from closer to 1.25 earlier.

The chart’s top panel charts the WTI price in 2023 and shows periods shaded in gray where the put/call ratio was below 1; broadly, these coincide with rising crude prices.

The importance of the Gulf producers

Israel and the Palestinian territories are not key oil producers, but many nations in the wider region are. The Middle East as a whole accounts for almost a third of global oil supply; Saudi Arabia accounts for about 12 percent and Iran about 4 percent. Iraq, the United Arab Emirates, Kuwait and Qatar are also significant producers.

The next chart tracks oil production by countries bordering the Persian Gulf over the years.   

The bottom pane of the chart tracks the Brent crude price’s relationship to Middle East oil production as a percent of world supply. This is where we see the price impact of OPEC’s production cuts and increases: the move to pump more oil from late 2014 is clearly visible, as is the sustained period of low prices that followed. OPEC’s production cut in late 2022 can also be seen.

Downside risks to supply from Saudi Arabia and Iran

The Israel-Hamas war comes at a delicate time.

Prior to the attacks, Saudi Arabia signaled to Washington that it could boost production in 2024, if required, to keep oil price pressures in check – but also as part of a deal that could see a normalisation of Saudi diplomatic relations with Israel and greater defense cooperation with the US (according to the Wall Street Journal).

As the war reduces the probability of a Saudi rapprochement with Israel in the short term, it lessens the chances of such a 2024 supply increase.

There are also downside risks to Iranian production. Before Hamas’ attack, in mid-September, the US and Iran agreed to release prisoners in a move that was seen as de-escalating tensions and potentially allowing for a gradual rise in Iranian oil sales. 

However, given Iran’s ties to Hamas, the conflict instead raises the possibility of tighter US sanctions on Iran.

The next chart is a different visualisation of the importance of Saudi and Iranian crude, which together account for about 16 percent of global supply. A month-on-month decline in combined Saudi and Iranian oil production in the past quickly translated into steeper month-on-month price changes and sharp volatility. The pandemic disruptions are most notable, but there are other month-on-month spikes of up to 25 percent.

Modeling price scenarios: USD 100-plus oil in 2024?

Crude prices are a function of several supply and demand dynamics.

Demand is driven by 1. overall economic growth; 2. growth potential in emerging markets, which are large oil consumers; 3. demographic and employment trends; 4. macroeconomic indicators, such as growth, inflation and exchange rates.  (We’re currently looking at a world of slowing GDP growth, concern about oil demand in China and sticky inflation that is denting consumers’ purchasing power.)

Supply factors include: 1. different sources of oil becoming viable to produce at various price points; 2. technological advancements influencing substitute production; 3. weather patterns; 4. regulatory changes, especially environmental policy; and 5. geopolitical events.

Using Macrobond’s partnership with Indicio, we constructed forecasting models to help gauge broad Brent price trends for: 

  • Status quo – no supply impact from the war; and
  • A scenario where oil supply is reduced

Our models‘ input parameters included broad macro indicators, such as world GDP growth; demand, i.e. oil consumption as released by OPEC; and oil production trends. Oil supply and year-on-year GDP growth estimates have the greatest influence on price trends.

All other things being equal, given a backdrop of slowing economic growth, Indicio’s weighted output from univariate and multivariate models predicts that Brent crude will slip toward USD 86 per barrel over the next year. 

We then ran the scenario analysis for adverse geopolitical fallout from a continued war in Gaza. 

If we factor in a 0.3 mbpd reduction in oil output from Saudi Arabia, we end up with a significantly higher oil price in a year’s time – closer to USD 103/barrel.

Learn how you can forecast like a PhD quant with Macrobond x Indicio

Non-farm payrolls may show only modest softening in the US job market

Our economist models healthy US employment using Indicio.

Meghna Shah
Macro Strategist & Chief Economist
Macrobond

All opinions expressed in this content are those of the contributor(s) and do not reflect the views of Macrobond Financial AB. All written and electronic communication from Macrobond Financial AB is for information or marketing purposes and does not qualify as substantive research.

The September non-farm payrolls report, a key data release watched by the Federal Reserve to gauge employment trends, is scheduled for release on Friday.

Using Macrobond’s partnership with Indicio Technologies, we were able to create a model for NFP. It suggests that September payrolls rose by 170,000 – only a marginal softening from the 187,000 print seen a month earlier.

Such models are built by seeking out the most explanatory variables available. So what is the data context for this healthy forecast?

Recent employment trends 

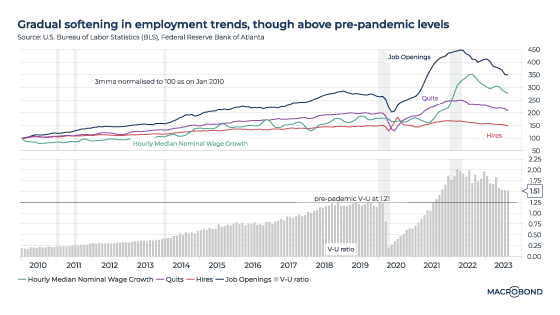
The August JOLTS (Job Openings and Labor Turnover Survey) data suggested that employment trends with Job openings (9.61 million), hires (5.857 million) and quits (3.64 million) remained well above pre-pandemic levels. 

Median nominal wage growth was 5.5 percent on a three-month m

oving average basis, also supporting the resilient trend.

Importantly, as the second panel in the chart shows, the vacancies-to-unemployed ratio – indicative of job market tightness and demand-supply mismatch – was 1.51, higher than the January 2020 level of 1.21.

The tight labour market through 2023 has supported US consumer spending, keeping core price pressures intact.

The gradual nature of the labour market normalisation process is shown in the next chart, which tracks the three-month moving averages of these four variables over the past 13 years. Year-to-date openings, hires, and wage growth have decelerated since the peaks seen in 2022. However, true labour-market normalisation – with demand and supply closer to pre-pandemic levels – might still take one or two more quarters, once the transmission of rate tightening has materialised on overall economic demand.

Personal consumption expenditures (PCE)

For August, core PCE – the Fed’s primary inflation gauge  – came in at 3.9 percent, as the gray zone in the next chart shows. (Last month, we used Indicio to forecast this data point accurately.) 

This provided little respite for either consumers or the Fed and its 2 percent inflation target. This stickiness in core inflation – broadly representing demand in the economy – is coming on the back of the surge seen in post-pandemic wages and employment numbers.

As we wrote in our forecast about two weeks ago – and as the second panel of our updated chart shows – almost 30 percent of the items in the PCE are showing price declines. But only 13 percent of expenditures are experiencing price declines.

For now, both core PCE and employment trends remain very relevant given the Fed’s data-dependent stance. 

These data points align with market expectations – shown in our final chart – that any rate-easing cycle seem unlikely before the second half of 2024.

Indicio’s automated forecasts are built using univariate and multivariate models, allowing you to combine different approaches to create a forecast that can potentially outperform any single model. For NFP, our models considered several employment-related indicators and data points related to monetary policy, inflation, consumer sentiment and more.

Learn how you can forecast like a PhD quant with Macrobond x Indicio

Using Indicio to forecast inflation on both sides of the Atlantic

Our economist constructs a model that shows sticky price increases in the short term.

Meghna Shah
Macro Strategist & Chief Economist
Macrobond

All opinions expressed in this content are those of the contributor(s) and do not reflect the views of Macrobond Financial AB. All written and electronic communication from Macrobond Financial AB is for information or marketing purposes and does not qualify as substantive research.

Monetary policy reaction functions target stable prices, maximum employment and moderate long-term interest rates conducive to balanced growth-inflation dynamics. Policy rates and hence yield curves evolve in line with these macro determinants - largely CPI. The shorter end of the curve is reactive to policy rate driven liquidity function while the longer end encompasses medium to long term growth and fiscal dynamics. The 1 year yield closely depicts the CPI index, normalised to 100 as of January 2022.

The high(er) for long(er) narrative prevails as seen in rising yields, despite policy rates seeming peakish. The data dependency optionality seems prudent to read inflation-related high frequency indicators with caution amid rising cost-push factors and sticky demand. Extrapolation of YTD inflation deceleration towards target rates seems unlikely, keeping the window for rate cuts closed in the near term.

US resiliency outweighs UK and EZ prospects: Fed raised its dot plot mindful of the upside risks to inflation. Impact of rate tightening transmission on overall demand has not materialised yet as seen in demand pull inflation numbers – the core PCE. In addition, cost push factors such as rising energy prices (crude, gasoline) and higher food prices can catch up in the headline. The comfort so far from rental and medical care inflation may wane. (Read more about the medical cost effect here.)

Market participants are assigning a 50-50 probability of a Fed rate hike by December 2023 given the US economy has remained less rate sensitive than the UK and Eurozone. Signs of a slowdown are evident in the UK, where retail sales and consumer spending sentiment have been contracting since 2022, while Germany is taking the blow from a contracting manufacturing sector and curbed household spending. The US, on the other hand, has remained resilient, gaining strength from consumer spending closer to pre-pandemic rate levels.

Higher yields reflect sticky inflation: Treasury yields at 15-year highs are reflecting the sticky core inflation and the 2 percent target being distant. PCE inflation figures indicate goods inflation supported lower trending headline rates since January, while services inflation and core inflation remained elevated.

Further, while 28 percent of items in the PCE are showing price declines, the expenditure share showing price declines remains low at 12 percent.

Comparisons are drawn to the 1980s Paul Volcker era: former Treasury Secretary Lawrence Summers stated it is "more likely than not" that the Federal Reserve will be surprised by the persistence of higher inflation and weaker-than-expected economic growth.

Near term inflation forecasts do not provide comfort.

Using Macrobond’s partnership with Indicio, we constructed models to predict the upcoming inflation figures in four countries scheduled to release them this week.

The models forecast US core PCE for August at 3.9 percent, Germany’s September preliminary CPI at 4.7 percent, France’s September preliminary CPI at 5.15 percent and Italy’s September preliminary CPI at 5.35 percent.  

Our models factored in interest-rate sensitivity, growth dynamics, employment trends, wage pressures, consumer resiliency and forward-looking surveys to focus on demand-pull inflation and various commodities (energy, etc.) to account for cost-push factors.

The month-on-month growth remains positive, indicating continued inflation momentum for now. Over the next few months we remain cautious on the inflation front: upside risks from energy prices tracking a cold winter, tight supply in the energy market, recent labour strikes keeping wage pressures intact, and rising agricultural commodity prices may provide little respite.

Meaningful inflation deceleration remains contingent upon a slowdown in discretionary demand. Further comfort on the inflation front could come at a cost of dwindled pent-up savings, a housing market slowdown, an easing labour market and wages and overall weaker growth prospects. Rate tightening transmission is likely to be felt in varied cycles across geographies.

Learn how you can forecast like a PhD quant with Macrobond x Indicio

A divergent outlook for central banks after a year of tightening

Our economist anticipates a week of decisions in the US, UK and Japan.

Meghna Shah
Macro Strategist & Chief Economist
Macrobond

All opinions expressed in this content are those of the contributor(s) and do not reflect the views of Macrobond Financial AB. All written and electronic communication from Macrobond Financial AB is for information or marketing purposes and does not qualify as substantive research.

Rate cycles seem peakish – though forward guidance from the central bankers at the Federal Reserve’s Jackson Hole symposium were testament to conveying “data dependency”: they’ll be monitoring how economic data will evolve and be revised, and thus keeping rate optionality open. Inflation remains the dominant factor driving policy stances, but these stances vary by country.

Recently, China cut its central bank’s reserve ratio requirement by 25 basis points following dovish data releases. By contrast, last week the European Central Bank raised rates by 25 basis points to curb inflationary pressures. The ECB signaled (and the market assumes) this was likely the end of the rate-tightening cycle, but again made reference to data dependency, theoretically keeping the door open for another hike.

As we begin a policy-heavy week – with the Fed, Bank of England and Bank of Japan announcing rate decisions between September 20 and 22 – how have economic data in these countries evolved?

Data releases and market positioning point towards a September pause from the Fed, a 25-basis-point hike by the Bank of England, and a further relaxation in Japan’s yield curve control policy.

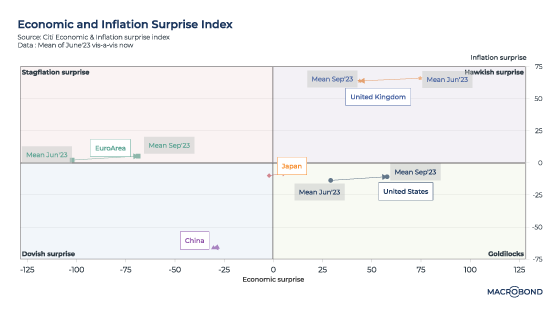
The following chart looks at “surprise” indices from Citigroup that track whether economic or inflation data releases are beating or trailing expectations.1 A broad classification for countries can have data indicating: “stagflation surprise,” “hawkish surprise,” “dovish surprise” or “Goldilocks” scenario:

Over the last three months, the US has seen an increased number of upside economic surprises, as has Japan. (Both nations are now in “Goldilocks.”) The UK has had markedly fewer hawkish surprises. China’s data remained dovish.

United States

A weaker US labour market is not a concern yet. Non-farm payrolls rose by 187,000 in August. JOLTS (Job Opening and Labor Turnover Survey) data has held up, with the seasonally adjusted job openings rate at 5.3 percent.

Core inflation has remained sticky. The core consumer price index (CPI) inched up 0.3 percent month on month, and core headline inflation was 4.3 percent for August. Energy had been pulling down inflation prints, but with higher crude prices, there could be an upward push ahead. The 2 percent CPI target remains far away.

As 2023 progressed, the Fed “pivot” that was widely anticipated was deferred further into the future. As the next chart shows, the futures market currently suggests that the Fed will “pause” this week, hike by another 25 basis points before the end of the year, and not start cutting until the second half of 2024.

United Kingdom

Inflation remains relatively high in Britain versus other economies: CPI stood at 6.8 percent for July. The labour market is losing steam, with unemployment climbing to 4.3 percent – the highest rate since 2021 -- though cost-of-living pressures are easing as wage growth catches up with inflation.

This stubborn wage growth – a median of 6.7 percent, on a three-month moving average – could well push core inflation higher and keep it above the 2 percent target. The next chart shows how wage increases are distributed across Britain, with London trailing other regions.

Japan

The Bank of Japan tweaked policy in July, allowing a greater range of government bond yield tolerance. This was followed by positive economic data surprises: stronger purchasing managers index prints (services PMI was 54.3), higher services inflation (which breached 2 percent), the highest pay increases in 30 years (an increase of about 4 percent announced by the government during labour negotiations) and the USD/JPY exchange rate reaching levels that last led to a Bank of Japan intervention in 2022.

Most data points suggest a gradual move towards policy normalisation from the current ultra-accommodative policies; relaxing the yield curve control cap further might well be considered.

1 Citi Inflation Surprise Indices are quantitative measures of inflation releases relative to market expectations. A positive reading of the Inflation Surprise Index suggests that inflation has on balance been higher than expected in recent history.

Citi Economic Surprise Indices are objective and quantitative measures of economic news. A positive reading of the Economic Surprise Index suggests that economic releases have on balance been beating consensus.