Welcome to the first blog post from the Product Team at Macrobond! We’re going to use these blog posts going forward to keep our community updated with relevant news, updates, and to ensure you all know how to get in touch with feedback about the things you love about Macrobond (and perhaps some of the things you don’t!).
App Start Page
If you came to this post from the application homepage, you’ll likely have noticed some changes.
First off, we want to acknowledge that there haven’t been many updates for a while - our apologies for that. We’re not fans of letting things go stale, but as you'll see in this post, we hit pause on a few things to focus our energy on some exciting new developments. Thanks for bearing with us.
At the time of publication, you may also have noticed that some historical posts have disappeared from the feed. This is due to the launch of our new website and brand materials (more on that below).
Rest assured, all the charts from our previous Charts of the Week and Blog posts are still available to you in the chart library. This has also had a revamp and a tidy up, more on that below.
The homepage itself will continue to go through a few changes in the months ahead – we’re planning to add in new training materials as well some new features to make the app quicker and easier to navigate. If you’ve any ideas on what you’d like to see, we’d love to hear from you. Drop us a line here.
Branding & Website
Our marketing team have been hard at work over the last couple of months updating our look and our messaging. We’ve gone for something fresh and clean but with some great colors and content to really make things pop. We hope you love it as much as we do!
Websites & Style Sheets
The first major thing you’ll notice is the corporate website (www.macrobond.com) has completely changed. I won’t list the changes as it’s a ground-up re-write so basically everything has changed 😊
Something else you may have noticed is the in-app branding, specifically the default style sheet has also changed. Anywhere you’re using the default style sheet (rather than your corporate one), you’ll notice the Macrobond logo and the chart colors for your existing charts have all been updated to match the new branding. If you notice any issues, our support team are there to assist – https://redir.macrobond.com/go/support
Finally, release notes and help.macrobond.com. As well as the corporate website changing we’re also working on overhauling our help site. As part of those changes, our release notes will now be published on the technical help site, rather than the corporate site as we felt this was the more logical place for them to live.
We’ll keep you updated as plans evolve for further changes to the help site but we’re looking at everything from improved navigation, to content and training, better search capabilities, more video and tutorial content and of course, AI helper agents.
Again – all thoughts and ideas appreciated you can reach us here.
Content
Another hot topic in the community has been Charts of the Week, or rather, the lack thereof. The decision to stop publishing CotW earlier wasn’t taken lightly. We know lots of our community found the posts useful, but we also felt it was time to change things up a bit. So, whilst we’ve taken down one publication, we’re going to replace it not with one, but with five new initiatives!
- Macro Trends –A monthly review of the top economic themes paired with charts and thought leadership from the Macrobond team.
- Macro Charts – A weekly chart publication highlighting the week’s major economic releases.
- Macro Moves – The one you all demanded most – A monthly publication featuring charts from the top 10 most used data sets on the platform.
- Macro Segments – A monthly chart pack with insights tailored to your individual business domain.
- Ask Macrobond – Another monthly publication featuring the most requested charts from our community. We’ll be running polls on LinkedIn to capture your thoughts, keep an eye out and get your voice heard!
Chart library changes
The chart library is an invaluable resource and something many of our users utilize regularly. It contains charts and publications going all the way back to 2019 as well as training materials and chart packs for specific geographies and sectors to get people going quickly with key data and charts. However, after six years of updates, we felt it was time for a bit of a tidy up.
So, our content team have been hard at work reviewing everything and we’ve made some changes to make the organization cleaner and simpler to navigate as well as removing out-of-date content. Those changes will go live with the upcoming release on June 2nd.
One important note – if you have links to any of the charts in the Chart Library embedded in PowerPoint / Excel or Word documents, those will need to be updated to reflect the new chart location in the chart library. This will also apply to anything you’ve cross-linked into a website or other distribution platform.
Any concerns, please contact our support team via https://redir.macrobond.com/go/support and we’ll assist.
New Release
Last but by no means least, we have our second release of the year coming soon. We’re targeting Monday June 2nd for the update to go live so keep an eye out for the in-app banner notifying you of the new version.
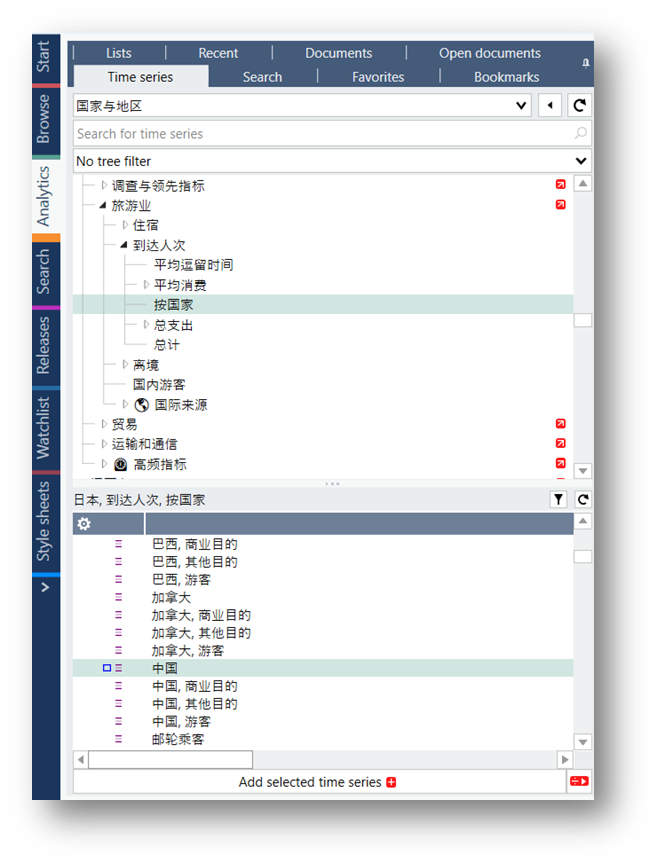
As always, there will be full release notes on the day but a couple of teasers – we’ve added SSO support so no more email and passwords and we’ve made improvements to the data search and navigation including popularity indicators for different series. There’s also a raft of updates and additions to our data content and API’s. More on all that soon…
If you managed to read all the way to here, then my thanks for your attention, I hope that was informative and useful reading.
I’ve dropped the link a few times already but we really do value your thoughts and input so please do feel free to drop us a line here with any requests or insights.
Thanks!
Dan Seal
Chief Product Officer, Macrobond.
![]()