- What is the Analysis tree?
- Structure of the Analysis tree
- Working with the Analysis tree
- Re-organizing the analysis tree
What is the Analysis tree?
The Analysis tree is the place for adding data, analyses, and charts. It consists of three different elements:
- The Series list, which includes all the data you add to a document
- The calculations you have applied to the data
- The presentation styles you have selected to visualize the data
You use the analysis tree to apply, organize and access these elements in developing your document. By adding or inserting different nodes in the tree, you can apply a variety of analyses and presentations to a data set, collected in a single document.
Structure of the Analysis tree
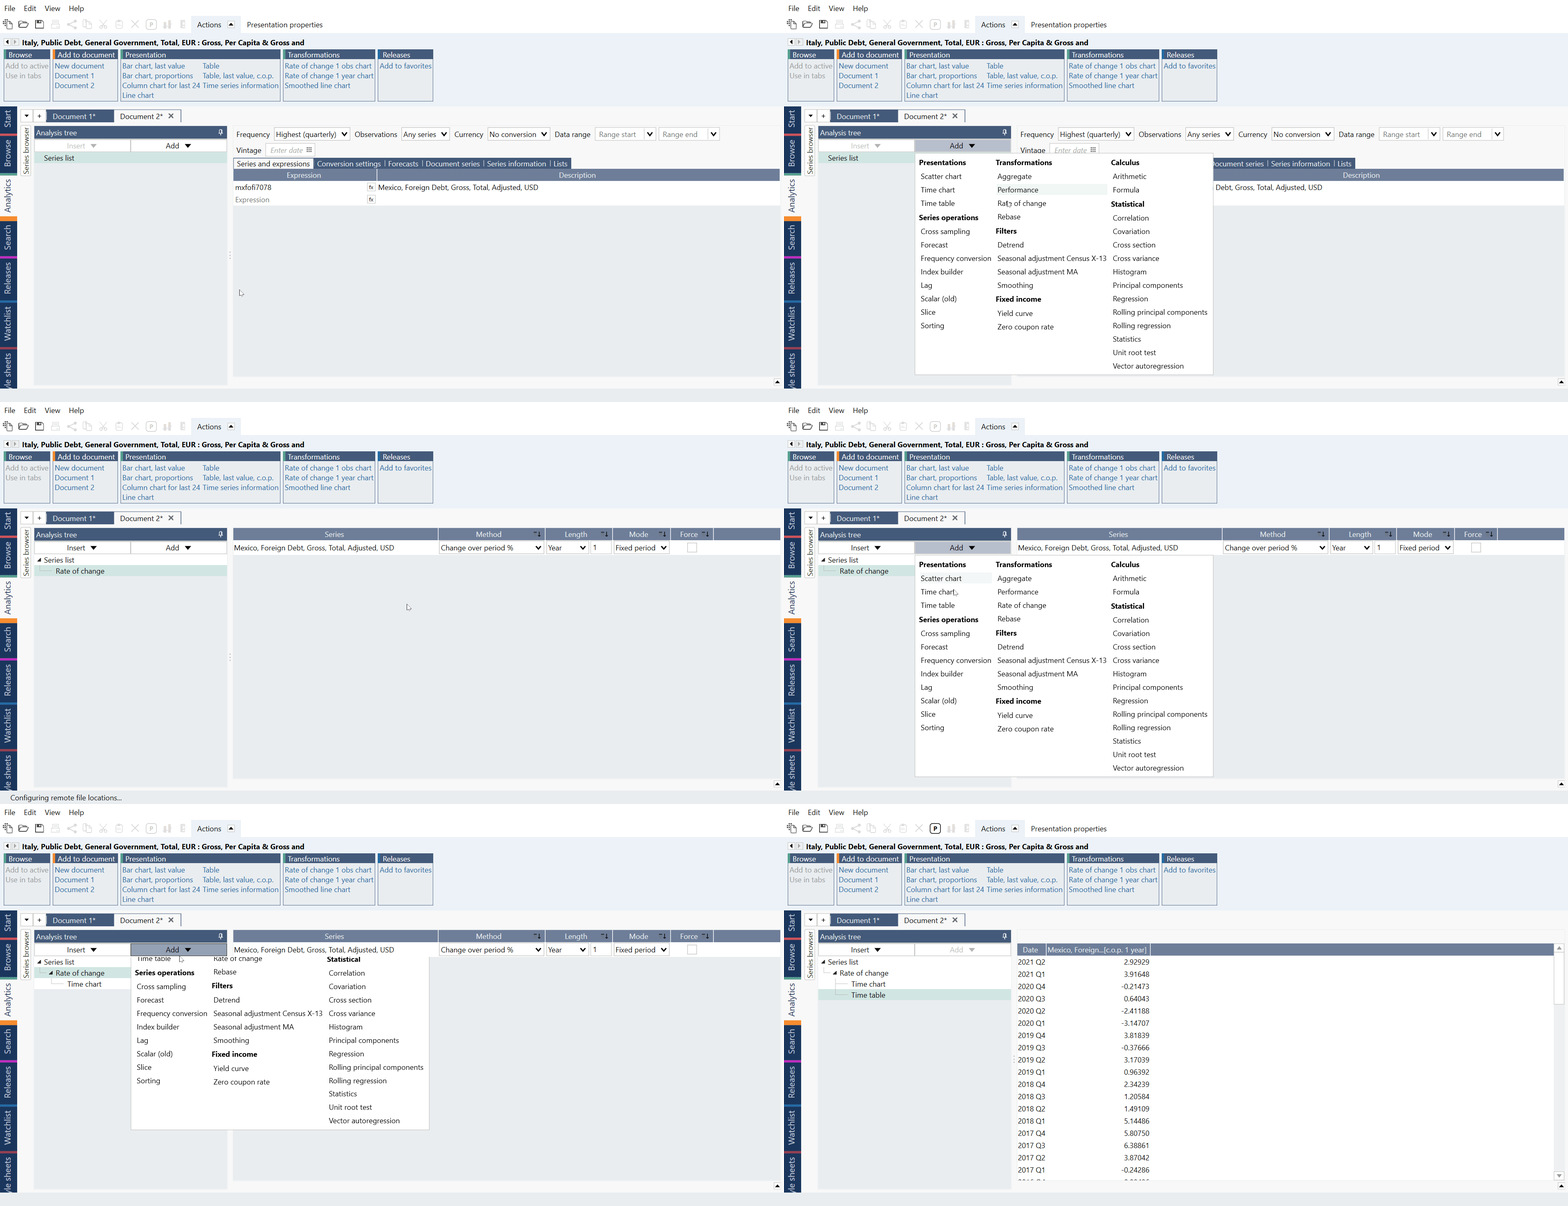
As you can see in the picture above, you start with the Series list, which is always the root node. You then apply one or more parent nodes containing calculations, or presentation styles. The output of each node is dependent on the preceding nodes it is grouped with.
The way you structure the analysis tree affects the output of the document. For example, adding a Forecast after a Rate of change analysis implies that the forecast will be calculated based on the rate of change calculation above.
Working with the Analysis tree
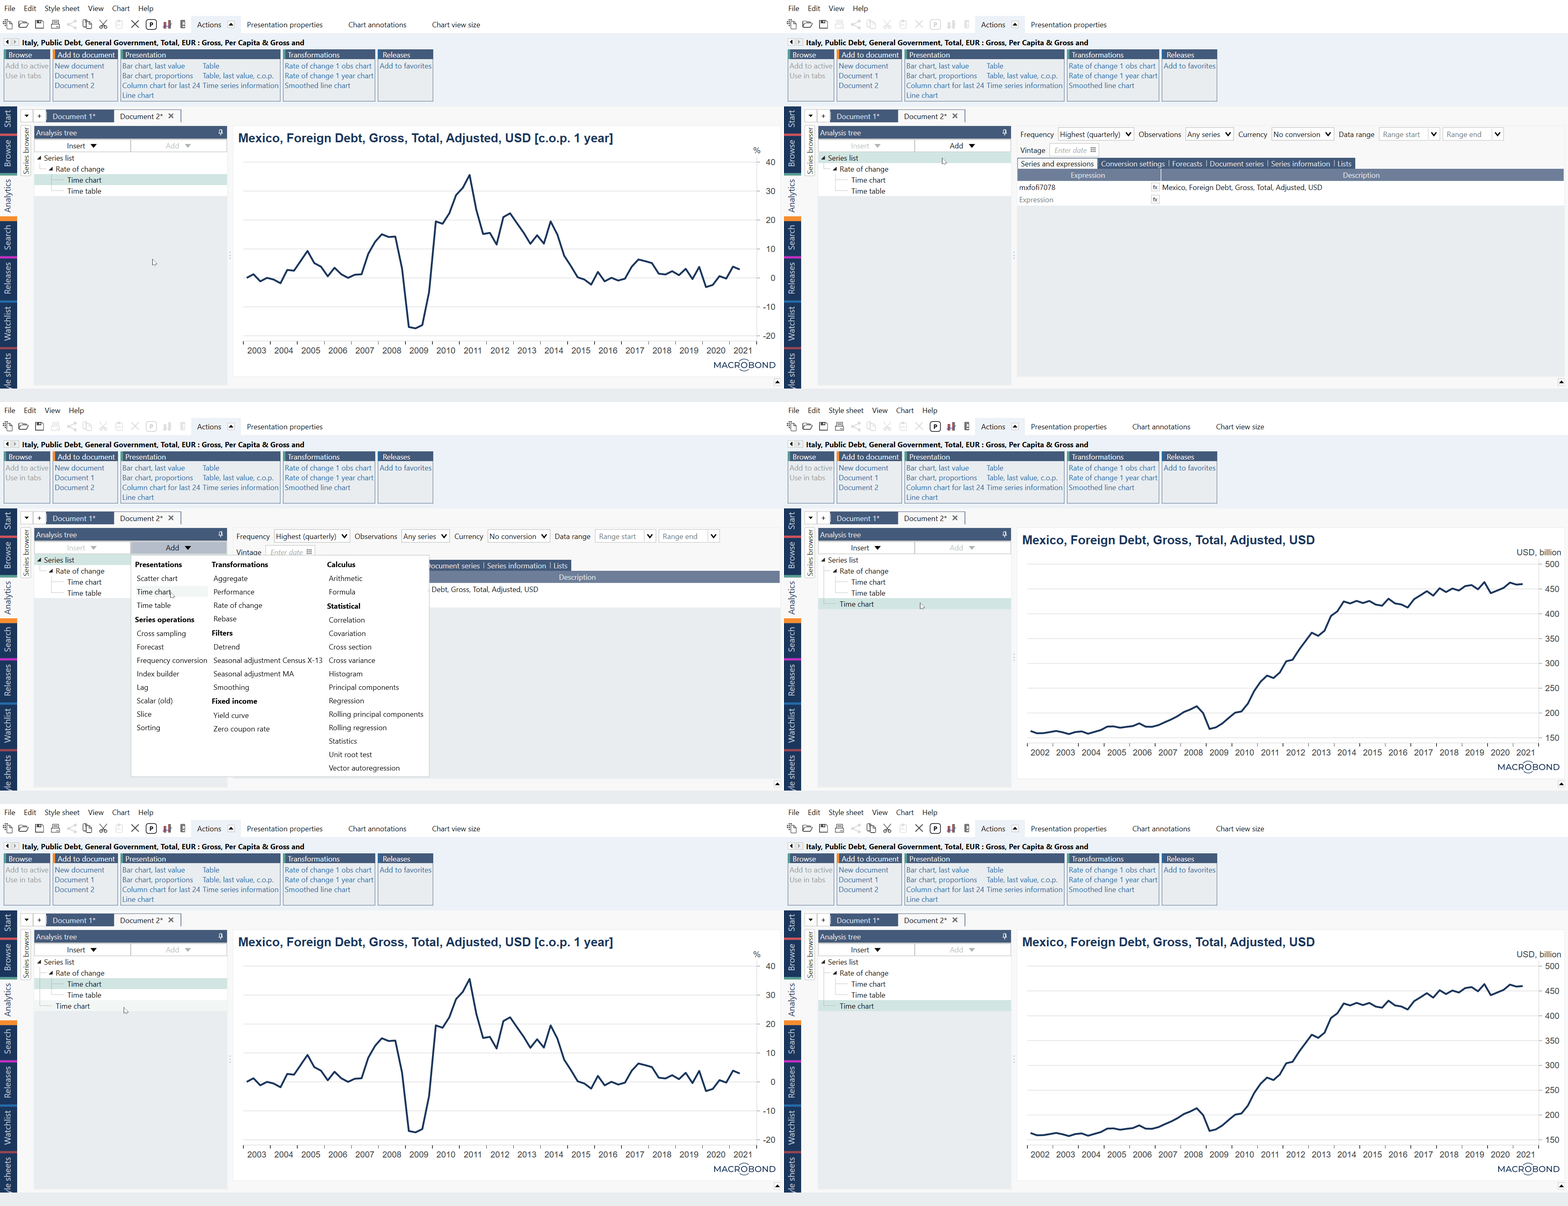
Use Add/Insert buttons to add analyses, charts, or tables. Because of the tree-like construction, in chart you will have available only the outcome of analysis (or analyses) above it. Chart or table at the end of one node won't contain outcome from other nodes.

In above example if you want to create a chart with raw series add Time chart from the Series list directly.

Add/Insert differences
The 'Add' button will add new analysis directly from the node you have selected. Below we have selected Rate of change and used Add > Regression. Now outcome from Rate of change will be accessible in Regression and Correlation analyses.
These two analyses (Regression and Correlation) are on the same level and aren't linked so outcome from Regression can't be used in Correlation and vice versa.
⇒
'Insert' is similar - it adds an analysis before selected node. Below we have selected Time chart and inserted Lag analysis. Thus, the order of calculation is now Rate of change > Lag >Time chart. Lag, Correlation and Regression are on the same level and won't affect each other.
⇒
Note that you cannot insert before Time chart/Time table analysis which produces category data. For example Scalar analysis works only with Category chart.
Working with many analyses
You can accumulate many analyses and use the results in the subsequent analysis. Sometimes it might be hard to track what comes under what so you can roll up the nodes with black triangle icon next to analysis name. See below Analysis tree with colors applied to each node (they won't be visible in application) and how it will look after folding.
⇒
If analysis is in a different node your only choice is to create Calculated in-house series from the outcome, add series on Series list and use it in another node.
Re-organizing the analysis tree
Moving analyses within a branch
⇒
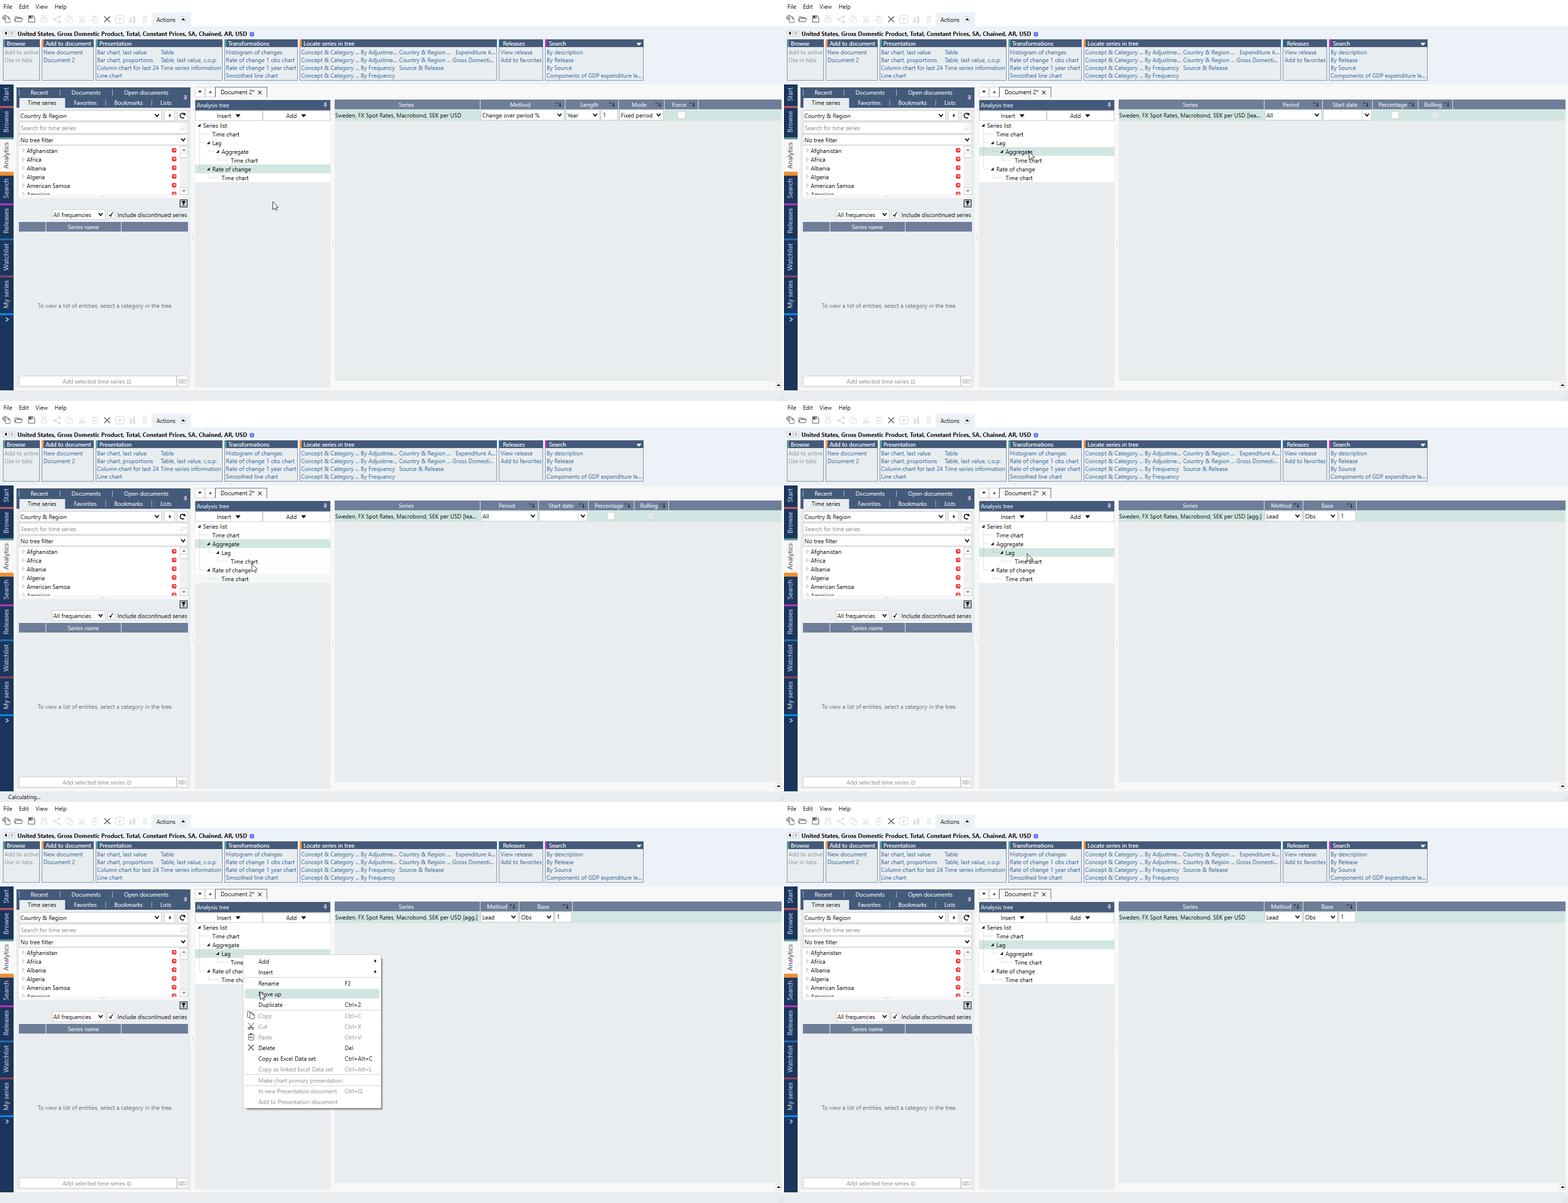
You can move analyses that are on the same level/branch up or down in the tree. This does not affect calculations but can help you to organize your document.
How to move up, rename, duplicate, or delete analysis
Besides Add and Insert there are a few more functions available via the context menu. These will help you make changes to the structure of the analysis tree.
Move up
Click on the branch you want to move to open the context menu and select 'Move up'.

Note that you can do this only if the lower analysis isn't accompanied by other analyses.
Rename
Right click on the branch you would like to rename or press F2. Type in the new name and click OK.
Renaming is a useful for quickly being able to identify the correct branch, when building documents with a large analysis tree.
Duplicate
- Right click on the branch containing the segments you would like to duplicate
- Select 'Duplicate' from the context menu, or use the keyboard shortcut Ctrl+2
By duplicating an entire block of calculations, you can quickly generate a new chart from the same data set and calculations, in order to compare different aspects of the data.
Delete
- Right click on the branch you want to delete
- Select delete from the context menu. (Since version 1.28 there is 'Delete with children' option available).
- Use the keyboard shortcut Ctrl+Z if you want to undo this.
See here pre-1.28 version view
To avoid accidentally deleting an entire block of calculations the command is only executed on the highlighted branch. That is, each branch must be selected and deleted separately.